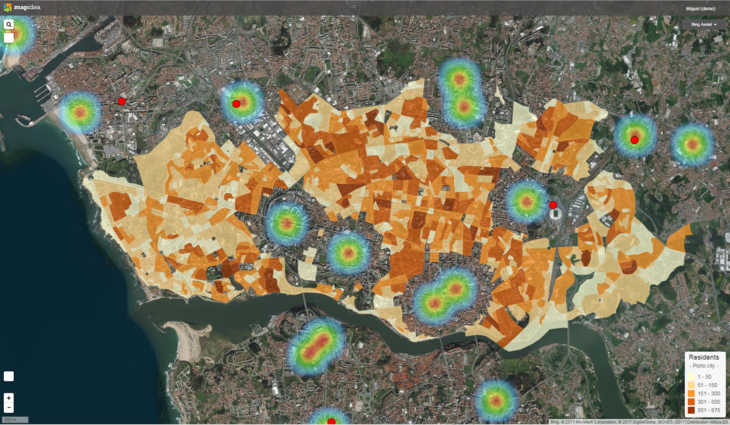
Taming Tech Overwhelm – Modernization for Growing Businesses

For many small and mid-sized organizations, technology can feel like a moving target. Every week brings a new buzzword (AI, automation, digital transformation) while your core systems feel increasingly outdated. Your data may be scattered across tools, workflows may depend on manual processes, and the thought of a major modernization project can feel overwhelming.

You’re not alone. Across industries, small and mid-sized organizations often struggle to keep up with the speed of technological change while balancing day-to-day operations. Yet modernization doesn’t have to be disruptive or intimidating. It is a strategic, step-by-step process that aligns your technology investments with your business goals and, when done right, it can be transformative.

This post will help you reframe modernization as a series of practical, achievable steps that move you from feeling overwhelmed to being ahead of the curve.

Why Modernization Feels Overwhelming

Small businesses frequently cite barriers like cost, lack of expertise, and integration complexity as reasons for delaying tech adoption. A 2023 study from AI Business found that many organizations hesitate to invest in modern solutions because of a lack of in-house expertise and concerns over security and ROI (AI Business, 2023). Similarly, a 2025 TechRadar report noted that small and mid-sized businesses (SMBs) often see technology investment as a financial risk, even while recognizing its necessity for growth (TechRadar, 2025).

40% of business leaders cite lack of expertise as a barrier to technology adoption.
(AI Business, 2023)

Yet, delaying modernization comes with its own costs: slower operations, missed opportunities, and competitive disadvantage. Encouragingly, businesses that have embraced digital tools overwhelmingly report efficiency gains and optimism about future growth (U.S. Chamber of Commerce, 2023).

The good news is that modernization doesn’t need to be a massive leap. A structured, goal-driven approach can help you take small, confident steps forward.

A Practical Approach to Modernization

Modernization should be driven by your strategic business goals, not by chasing the latest technology trend. Here’s an approach to help you get started.

1. Start with Your Goals, Not the Tech

Before looking at software, hardware, or AI models, ask yourself: “What business problems do I need to solve?” Are you trying to speed up workflows, improve decision-making, enhance customer experience, support growth, or a combination of these and other goals?

When organizations align IT initiatives with clear business objectives, they see higher ROI and faster decision-making (Davenport, 2024). Modernization is most effective when it’s a means to an end, not an end in itself.

2. Audit Your Workflows and Data

A modernization journey should start with a clear picture of your current state:

  • Workflows: Identify bottlenecks, redundant tasks, or manual processes that slow your team down.
  • Data: Evaluate the quality and organization of your data. What’s reliable? What needs cleaning? Are there gaps preventing meaningful analysis?

This audit creates a roadmap for targeted improvements. Often, even simple steps—like consolidating duplicate data sources or automating a repetitive report—can deliver measurable time savings. 

The term “audit” can be overwhelming in itself, as we often picture a laborious, top-down, expensive deconstruction of every process. While that can be useful, it’s not always necessary. Often, you or your staff are already intimately familiar with the inefficiencies in your operations and these can be captured via interviews. This is often enough to get started.

3. Prioritize Small, High-Impact Wins

Modernization doesn’t have to mean overhauling everything at once. Start small:

  • Automate a single, repetitive process.
  • Consolidate reporting into a single dashboard.
  • Migrate one high-value workflow to a cloud-based solution.

These small wins build momentum, reduce team anxiety, and demonstrate clear ROI, paving the way for larger initiatives.

That second benefit, reducing team anxiety, is important. While we can all recognize inefficiencies, the inefficiency you know often causes less anxiety than the improvement you don’t. Getting your team comfortable with some small, early wins builds confidence in the overall process to come.

4. Build a Scalable Technology Strategy

Once you’ve addressed the most obvious inefficiencies, it’s time to lay a scalable foundation for growth. In this context, “scalability” simply means your technology can handle increased demand, complexity, or new functionality without needing a total replacement.

Scalability means your systems should grow as you grow—without costly rebuilds.

For small and medium-sized organizations, this often doesn’t mean buying the most expensive enterprise software. It can mean:

  • Choosing cloud platforms and analytics tools that allow you to add users, storage, or features incrementally.
  • Using modular systems that make it easy to plug in new capabilities—like automation or AI—when you’re ready.
  • Designing workflows so that new services, staff, or customers can be added without reworking everything from scratch.

By focusing on flexibility instead of “big tech,” you create systems that evolve alongside your organization’s needs. This approach can save money in the long run and reduces the stress of future growth.

Make AI and Automation Accessible

Artificial intelligence (AI) and automation are often seen as intimidating, but they don’t have to be. The key is to view AI as a tool to augment decision-making and streamline workflows rather than as a complex, abstract concept.

Practical applications include:

  • Automating repetitive reporting or data entry tasks.
  • Using predictive analytics to forecast demand or identify trends.
  • Applying natural language processing (NLP) to analyze customer feedback.

By starting with small, low-risk pilot projects, you can test AI solutions, measure results, and gain confidence in scaling them further. These pilots often produce immediate efficiency gains, helping you build internal support for deeper adoption.

Targeted Expertise

Many growing organizations delay modernization because they don’t have a CIO, CTO, or internal team member to lead the effort. This is where fractional executive leadership or embedded technical advisors can make a difference.

A skilled advisor provides:

  • Strategic vision: Ensuring your technology roadmap supports your goals.
  • Vendor neutrality: Recommending the right tools for your needs, not pushing a specific platform.
  • Execution support: Overseeing implementation to reduce risk and avoid costly missteps.
  • Knowledge transfer: Building your internal team’s capability over time.

At Cercana, we pair executive-grade advisory services with hands-on delivery, helping organizations modernize confidently without the overhead of a full-time executive hire. Our goal is to guide you through modernization while helping you build your internal capacity so that you can move into the future on your own.

Moving Forward with Confidence

Modernization isn’t a single project; it’s an ongoing journey that starts with understanding your goals, streamlining workflows, and building a flexible foundation. By breaking the process into manageable steps and leveraging expert guidance, you can move from feeling overwhelmed to gaining a competitive edge.

The organizations that thrive in today’s landscape are those that see technology as a growth enabler rather than a burden. With the right plan and guidance, modernization can unlock new opportunities, create efficiencies, and position your business for long-term success.

Ready to start your journey? Let’s talk. We’ll help you identify your highest-impact opportunities, design a strategy that works for your business, and deliver clarity at every step.

References

AI Business. (2023, June 21). Small-medium businesses face barriers to technology adoption. AI Business. https://aibusiness.com/verticals/small-medium-businesses-face-barriers-to-technology-adoption

Davenport, L. (2024, October 27). Business and IT alignment: Why is it so important? Davenport Group. https://davenportgroup.com/insights/business-and-it-alignment-why-is-it-so-important/

TechRadar. (2025, April 1). SMBs want to use tech more in order to grow—but costs are proving a big barrier. TechRadar Pro. https://www.techradar.com/pro/smbs-want-to-use-tech-more-in-order-to-grow-but-costs-are-proving-a-big-barrier

U.S. Chamber of Commerce. (2023, September 14). The impact of technology on U.S. small businesses. U.S. Chamber of Commerce. https://www.uschamber.com/small-business/smallbusinesstech

Header Image: Bernd Fiedler, CC BY-SA 4.0 https://creativecommons.org/licenses/by-sa/4.0, via Wikimedia Commons

Geospatial Without Maps

When most people hear “geospatial,” they immediately think of maps. But in many advanced applications, maps never enter the picture at all. Instead, geospatial data becomes a powerful input to machine learning workflows, unlocking insights and automation in ways that don’t require a single visual.

At its core, geospatial data is structured around location—coordinates, areas, movements, or relationships in space. Machine learning models can harness this spatial logic to solve complex problems without ever generating a map. For example:

  • Predictive Maintenance: Utility companies use the GPS coordinates of assets (like transformers or pipelines) to predict failures based on environmental variables like elevation, soil type, or proximity to vegetation (AltexSoft, 2020). No map is needed—only spatially enriched feature sets for training the model.
  • Crop Classification and Yield Prediction: Satellite imagery is commonly processed into grids of numerical features (such as NDVI indices, surface temperature, soil moisture) associated with locations. Models use these purely as tabular inputs to predict crop types or estimate yields (Dash, 2023).
  • Urban Mobility Analysis: Ride-share companies model supply, demand, and surge pricing based on geographic patterns. Inputs like distance to transit hubs, density of trip starts, or average trip speeds by zone feed machine learning models that optimize logistics in real time (MIT Urban Mobility Lab, n.d.).
  • Smart Infrastructure Optimization: Photometrics AI employs geospatial AI to enhance urban lighting systems. By integrating spatial data and AI-driven analytics, it optimizes outdoor lighting to ensure appropriate illumination on streets, sidewalks, crosswalks, and bike lanes while minimizing light pollution in residential areas and natural habitats. This approach not only improves safety and energy efficiency but also supports environmental conservation efforts (EvariLABS, n.d.).

These examples show how spatial logic—such as spatial joins, proximity analysis, and zonal statistics—can drive powerful workflows even when no visualization is involved. In each case, the emphasis shifts from presenting information to enabling analysis and automation. Features are engineered based on where things are, not just what they are. However, once the spatial context is baked into the dataset, the model itself treats location-derived features just like any other numerical or categorical variable.

Using geospatial technology without maps allows organizations to focus on operational efficiency, predictive insights, and automation without the overhead of visualization. In many workflows, the spatial relationships between objects are valuable as data features rather than elements needing human interpretation. By integrating geospatial intelligence directly into machine learning models and decision systems, businesses and governments can act on spatial context faster, at scale, and with greater precision.

To capture these relationships systematically, spatial models like the Dimensionally Extended nine-Intersection Model (DE-9IM) (Clementini & Felice, 1993) provide a critical foundation. In traditional relational databases, connections between records are typically simple—one-to-one, one-to-many, or many-to-many—and must be explicitly designed and maintained. DE-9IM extends this by defining nuanced geometric interactions, such as overlapping, touching, containment, or disjointness, which are implicit in the spatial nature of geographic objects. This significantly reduces the design and maintenance overhead while allowing for much richer, more dynamic spatial relationships to be leveraged in analysis and workflows.

By embedding DE-9IM spatial predicates into machine learning workflows, organizations can extract richer, context-aware features from their data. For example, rather than merely knowing two infrastructure assets are ‘related,’ DE-9IM enables classification of whether one is physically inside a risk zone, adjacent to a hazard, or entirely separate—substantially improving the precision of classification models, risk assessments, and operational planning.

Machine learning and AI systems benefit from the DE-9IM framework by gaining access to structured, machine-readable spatial relationships without requiring manual feature engineering. Instead of inferring spatial context from raw coordinates or designing custom proximity rules, models can directly leverage DE-9IM predicates as input features. This enhances model performance in tasks such as spatial clustering, anomaly detection, and context-aware classification, where the precise nature of spatial interactions often carries critical predictive signals. Integrating DE-9IM into AI pipelines streamlines spatial feature extraction, improves model explainability, and reduces the risk of omitting important spatial dependencies.

Harnessing geospatial intelligence without relying on maps opens up powerful new pathways for innovation, operational excellence, and automation. Whether optimizing infrastructure, improving predictive maintenance, or enriching machine learning models with spatial logic, organizations can leverage these techniques to achieve better outcomes with less overhead. At Cercana Systems, we specialize in helping clients turn geospatial data into actionable insights that drive real-world results. Ready to put geospatial AI to work for you? Contact us today to learn how we can help you modernize and optimize your data-driven workflows.

References

Clementini, E., & Felice, P. D. (1993). A model for representing topological relationships between complex geometric objects. ACM Transactions on Information Systems, 11(2), 161–193. https://doi.org/10.1016/0020-0255(95)00289-8

AltexSoft. (2020). Predictive maintenance: Employing IIoT and machine learning to prevent equipment failures. AltexSoft. https://www.altexsoft.com/blog/predictive-maintenance/

Dash, S. K. (2023, May 10). Crop classification via satellite image time-series and PSETAE deep learning model. Medium. https://medium.com/geoai/crop-classification-via-satellite-image-time-series-and-psetae-deep-learning-model-c685bfb52ce

MIT Urban Mobility Lab. (n.d.). Machine learning for transportation. Massachusetts Institute of Technology. https://mobility.mit.edu/machine-learning

EvariLABS. (2025, April 14). Photometrics AI. https://www.linkedin.com/pulse/what-counts-real-roi-streetlight-owners-operators-photometricsai-vqv7c/

Cercana At FedGeoDay

Cercana Systems is excited to share that our entire team will be in attendance at FedGeoDay 2025! This is a great opportunity to meet with us face-to-face and learn more about our capabilities and the work we do. The event is happening April 22, 2025 at the Department of Interior’s Yates Auditorium in Washington, D.C. 

Company President Bill Dollins will be moderating a panel discussion on “Demystifying AI” at 4 p.m. The panel will feature input from multiple experts from across the geospatial and AI communities. 

We’re looking forward to meeting and engaging with a host of people from around the country who utilize, contribute to, and advocate for open geospatial ecosystems. We hope to see you there!

Why Young Professionals Should Get Out of the Office and Into Industry Events

In today’s fast-paced professional world, it’s easy for young professionals to assume that hard work alone will get them ahead. While grinding at the desk and delivering results matters, relying solely on your work to speak for itself may leave you overlooked in a competitive field. Getting out of the office and into local conferences, workshops, and networking events can provide invaluable opportunities that simply can’t be replicated from behind a desk.

Build Meaningful Professional Relationships

Networking remains one of the most powerful tools for career growth. According to a 2023 LinkedIn survey, 85% of job roles are filled through networking, not traditional applications. Attending local conferences puts you face-to-face with people in your industry—from potential mentors and collaborators to future employers and clients. These relationships can open doors to new opportunities that might never make it to job boards or public listings.

Stay Current With Industry Trends

Local events are also a great way to keep your knowledge sharp and up to date. Industry leaders often use conferences as platforms to discuss the latest trends, tools, and innovations. The Harvard Business Review emphasizes that staying current with changes in your field helps you remain relevant and competitive, especially in industries being rapidly transformed by technology and globalization (HBR, 2021).

Showcase Yourself Beyond the Resume

When you attend events, you get the chance to show people not just what you do—but how you do it. Your communication style, curiosity, and initiative become part of the impression you make. This visibility can lead to referrals, collaborations, or speaking invitations, all of which enhance your professional reputation in ways your LinkedIn profile alone cannot.

Gain Confidence and Soft Skills

Finally, stepping into a room full of peers and industry veterans can be intimidating—but it’s also empowering. Each interaction hones your communication skills, boosts your confidence, and teaches you how to navigate complex social dynamics in a professional context—critical soft skills that employers value highly.

Bottom Line

If you’re a young professional looking to grow, staying in your comfort zone won’t cut it. Attending local conferences and events is more than just networking—it’s about investing in your personal and professional development. Get out there, be visible, and let the right people see what you’re capable of.

Sources

Demystifying the Medallion Architecture for Geospatial Data Processing

Introduction

Geospatial data volumes and complexity are growing due to diverse sources, such as GPS, satellite imagery, and sensor data. Traditional geospatial processing methods face challenges, including scalability, handling various formats, and ensuring data consistency. The medallion architecture offers a layered approach to data management, improving data processing, reliability, and scalability. While the medallion architecture is often associated with specific implementation such as the Delta Lake, its concepts are applicable to other technical implementations. This post introduces the medallion architecture and discusses two workflows—traditional GIS-based and advanced cloud-native—to demonstrate how it can be applied to geospatial data processing.

Overview of the Medallion Architecture

The medallion architecture was developed to address the need for incremental, layered data processing, especially in big data and analytics environments. It is composed of three layers:

  • Bronze Layer: Stores raw data as-is from various sources.
  • Silver Layer: Cleans and transforms data for consistency and enrichment.
  • Gold Layer: Contains aggregated and optimized data ready for analysis and visualization.

The architecture is particularly useful in geospatial applications due to its ability to handle large datasets, maintain data lineage, and support both batch and real-time data processing. This structured approach ensures that data quality improves progressively, making downstream consumption more reliable and efficient.

Why Geospatial Data Architects Should Consider the Medallion Architecture

Geospatial data processing involves unique challenges, such as handling different formats (raster, vector), managing spatial operations (joins, buffers), and accommodating varying data sizes. Traditional methods struggle when scaling to large, real-time datasets or integrating data from multiple sources. The medallion architecture addresses these challenges through its layered approach. The bronze layer preserves the integrity of raw data, allowing for transformations to be traced easily. The silver layer handles transformations of the data, such as projections, spatial joins, and data enrichment. The gold layer provides ready-to-consume, performance optimized data ready for downstream systems. 

Example Workflow 1: Traditional GIS-Based Workflow  

For organizations that rely on established GIS tools or operate with limited cloud infrastructure, the medallion architecture provides a structured approach to data management while maintaining compatibility with traditional workflows. This method ensures efficient handling of both vector and raster data, leveraging familiar GIS technologies while optimizing data accessibility and performance.  

This workflow integrates key technologies to support data ingestion, processing, and visualization. FME serves as the primary ETL tool, streamlining data movement and transformation. Object storage solutions like AWS S3 or Azure Blob Storage store raw spatial data, ensuring scalable and cost-effective management. PostGIS enables spatial analysis and processing for vector datasets. Cloud-Optimized GeoTIFFs (COGs) facilitate efficient access to large raster datasets by allowing partial file reads, reducing storage and processing overhead. 

Bronze – Raw Data Ingestion 

The process begins with the ingestion of raw spatial data into object storage. Vector datasets, such as Shapefiles and CSVs containing spatial attributes, are uploaded alongside raster datasets like GeoTIFFs. FME plays a crucial role in automating this ingestion, ensuring that all incoming data is systematically organized and accessible for further processing.  

Silver – Data Cleaning and Processing

At this stage, vector data is loaded into PostGIS, where essential transformations take place. Operations such as spatial joins, coordinate system projections, and attribute filtering help refine the dataset for analytical use. Meanwhile, raster data undergoes optimization through conversion into COGs using FME. This transformation enhances performance by enabling GIS applications to read only the necessary portions of large imagery files, improving efficiency in spatial analysis and visualization.  

Gold – Optimized Data for Analysis and Visualization  

Once processed, the refined vector data in PostGIS and optimized raster datasets in COG format are made available for GIS tools. Analysts and decision-makers can interact with the data using platforms such as QGIS, Tableau, or Geoserver. These tools provide the necessary visualization and analytical capabilities, allowing users to generate maps, conduct spatial analyses, and derive actionable insights.  

This traditional GIS-based implementation of medallion architecture offers several advantages. It leverages established GIS tools and workflows, minimizing the need for extensive retraining or infrastructure changes. It is optimized for traditional environments yet still provides the flexibility to integrate with hybrid or cloud-based analytics platforms. Additionally, it enhances data accessibility and performance, ensuring that spatial datasets remain efficient and manageable for analysis and visualization.  

By adopting this workflow, organizations can modernize their spatial data management practices while maintaining compatibility with familiar GIS tools, resulting in a seamless transition toward more structured and optimized data handling. 

Example Workflow 2: Advanced Cloud-Native Workflow  

For organizations managing large-scale spatial datasets and requiring high-performance processing in cloud environments, a cloud-native approach to medallion architecture provides scalability, efficiency, and advanced analytics capabilities. By leveraging distributed computing and modern storage solutions, this workflow enables seamless processing of vector and raster data while maintaining cost efficiency and performance.  

This workflow is powered by cutting-edge cloud-native technologies that optimize storage, processing, and version control. 

Object Storage solutions such as AWS S3, Google Cloud Storage, or Azure Blob Storage serve as the foundation for storing raw geospatial data, ensuring scalable and cost-effective data management. Apache Spark with Apache Sedona enables large-scale spatial data processing, leveraging distributed computing to handle complex spatial joins, transformations, and aggregations. Delta Lake provides structured data management, supporting versioning and ACID transactions to ensure data integrity throughout processing. RasterFrames or Rasterio facilitate raster data transformations, including operations like mosaicking, resampling, and reprojection, while optimizing data storage and retrieval.  

Bronze – Raw Data Ingestion

The workflow begins by ingesting raw spatial data into object storage. This includes vector data such as GPS logs in CSV format and raster data like satellite imagery stored as GeoTIFFs. By leveraging cloud-based storage solutions, organizations can manage and access massive datasets without traditional on-premises limitations.  

Silver – Data Processing and Transformation

At this stage, vector data undergoes large-scale processing using Spark with Sedona. Distributed spatial operations such as filtering, joins, and projections enable efficient refinement of large datasets. Meanwhile, raster data is transformed using RasterFrames or Rasterio, which facilitate operations like mosaicking, resampling, and metadata extraction. These tools ensure that raster datasets are optimized for both analytical workloads and visualization purposes.  

Gold – Optimized Data for Analysis and Visualization

Once processed, vector data is stored in Delta Lake, where it benefits from structured storage, versioning, and enhanced querying capabilities. This ensures that analysts can access well-maintained datasets with full historical tracking. Optimized raster data is converted into Cloud-Optimized GeoTIFFs, allowing efficient cloud-based visualization and integration with GIS tools. These refined datasets can then be used in cloud analytics environments or GIS platforms for advanced spatial analysis and decision-making.  

This cloud-native implementation of medallion architecture provides several advantages for large-scale spatial data workflows. It features high scalability, enabling efficient processing of vast datasets without the constraints of traditional infrastructure, parallelized data transformations, significantly reducing processing time through distributed computing frameworks, and cloud-native optimizations, ensuring seamless integration with advanced analytics platforms, storage solutions, and visualization tools.  

By adopting this approach, organizations can harness the power of cloud computing to manage, analyze, and visualize geospatial data at an unprecedented scale, improving both efficiency and insight generation.  

Comparing the Two Workflows

AspectTraditional Workflow (FME + PostGIS)Advanced Workflow (Spark + Delta Lake)
ScalabilitySuitable for small to medium workloadsIdeal for large-scale datasets
TechnologiesFME, PostGIS, COGs, file system or object storageSpark, Sedona, Delta Lake, RasterFrames, object storage
Processing MethodSequential or batch processingParallel and distributed processing
PerformanceLimited by local infrastructure or on-premise serversOptimized for cloud-native and distributed environments
Use CasesSmall teams, traditional GIS setups, hybrid cloud setupsLarge organizations, big data environments

Key Takeaways

The medallion architecture offers much needed flexibility and scalability for geospatial data processing. It meshes well with traditional workflows using FME and PostGIS, which is effective for organizations with established GIS infrastructure. Additionally, it can be used in cloud-native workflows using Apache Spark and Delta Lake to provide scalability for large-scale processing. Both of these workflows can be adapted depending on the organization’s technological maturity and requirements. 

Conclusion

Medallion architecture provides a structured, scalable approach to geospatial data management, ensuring better data quality and streamlined processing. Whether using a traditional GIS-based workflow or an advanced cloud-native approach, this framework helps organizations refine raw spatial data into high-value insights. By assessing their infrastructure and data needs, teams can adopt the workflow that best aligns with their goals, optimizing efficiency and unlocking the full potential of their geospatial data.

Three Ways to Use GeoPandas in Your ArcGIS Workflow

Introduction

When combining open-source GIS tools with the ArcGIS ecosystem, there are a handful of challenges one can encounter. The compatibility of data formats, issues with interoperability, tool chain fragmentation, and performance at scale come to mind quickly. However, the use of the open-source Python library GeoPandas can be an effective way of working around these problems. When working with GeoPandas, there’s a simple series of steps to follow – you start with the data in ArcGIS, process it with the GeoPandas library, and import it back into ArcGIS.

It is worth noting that ArcPy and GeoPandas are not mutually exclusive. Because of its tight coupling with ArcGIS, it may be advantageous to use ArcPy in parts of your workflow and pass your data off to GeoPandas for other parts. This post covers three specific ways GeoPandas can enhance ArcGIS workflows and why it can better than using ArcPy in some cases.

Scenario 1: Spatial Joins Between Large Datasets

Spatial joins in ArcPy can be computationally expensive and time-consuming, especially for large datasets, as they process row by row and write to disk. GeoPandas’ gpd.sjoin() provides a more efficient in-memory alternative for point-to-polygon and polygon-to-polygon joins, leveraging Shapely’s spatial operations. While GeoPandas can be significantly faster for moderately large datasets that fit in memory, ArcPy’s disk-based approach may handle extremely large datasets more efficiently. GeoPandas also simplifies attribute-based filtering and aggregation, making it easier to summarize data—such as joining customer locations to sales regions and calculating total sales per region. Results can be exported to ArcGIS-compatible formats, though conversion is required. For best performance, enabling spatial indexing (gdf.sindex) in GeoPandas is recommended.

Bplewe, CC BY-SA 4.0 https://creativecommons.org/licenses/by-sa/4.0, via Wikimedia Commons

Scenario 2: Geometric Operations (Buffering, Clipping, and Dissolving Features)

Buffering and dissolving in ArcPy can be memory-intensive and time-consuming, particularly for large or complex geometries. Using functions like buffer(), clip(), and dissolve() to preprocess geometries before importing them back to ArcGIS is an effective solution to that problem. These functions can help make a multitude of processes more efficient. They can create buffer zones around road networks, dissolve any overlapping zones, and export the results as a new feature class for ArcGIS-based impact analysis. 

These functions can be cleaner and more efficient with regards to geometry processing than ArcPy and require fewer steps to carry out. They also integrate well with data science workflows using pandas-like syntax. 

Below is a detailed side-by-side comparison of GeoPandas and ArcPy for spatial analysis operations, specifically focusing on buffering and dissolving tasks.

AspectGeoPandas 🐍ArcPy 🌎
Processing SpeedFaster for medium-sized datasets due to vectorized NumPy/Shapely operations. Slows down with very large datasets.Slower for smaller datasets but optimized for large-scale GIS processing due to disk-based operations.
Memory UsageFully in-memory, efficient for moderately large data but can struggle with very large datasets.Uses ArcGIS’s optimized storage and caching mechanisms, which help handle large datasets without running out of RAM.
Ease of UseRequires fewer lines of code; syntax is cleaner for many operations.More verbose; requires handling geoprocessing environments and ArcPy-specific data structures.
Buffering CapabilitiesUses GeoSeries.buffer(distance), efficient but requires a projected CRS.arcpy.Buffer_analysis(), supports geodesic buffers and larger datasets more reliably.
Dissolve FunctionalityGeoDataFrame.dissolve(by=”column”), vectorized and fast for reasonably large data.arcpy.Dissolve_management(), slower for small datasets but scales better for massive datasets.
Coordinate System HandlingRequires explicit CRS conversion for accurate distance-based operations.Natively supports geodesic buffering (without requiring projection changes).
Data FormatsWorks with GeoDataFrames, exports to GeoJSON, Shapefile, Parquet, etc.Works with File Geodatabases (.gdb), Shapefiles, and enterprise GIS databases.
Integration with ArcGISRequires conversion (e.g., gdf.to_file(“data.shp”)) before using results in ArcGIS.Seamless integration with ArcGIS software and services.
Parallel Processing SupportLimited parallelism (can use Dask or multiprocessing for workarounds).Can leverage ArcGIS Pro’s built-in multiprocessing tools.
License RequirementsOpen-source, free to use.Requires an ArcGIS license.

Scenario 3: Bulk Updates and Data Cleaning

When performing bulk updates (e.g., modifying attribute values, recalculating fields, or updating geometries), ArcPy and GeoPandas have different approaches and performance characteristics. ArcPy uses a cursor-based approach, applying updates row-by-row. GeoPandas uses an in-memory GeoDataframe and vectorized operations via the underlying Pandas library. This can make GeoPandas orders of magnitude faster on bulk updates than ArcPy, but it can be memory intensive. Modern computing systems generally have a lot of memory so this is rarely a concern but, if you are working in a memory-constrained environment, ArcPy may suit your needs better.

Here is a side-by-side comparison:

FeatureGeoPandas 🐍ArcPy 🌎
Processing ModelUses in-memory GeoDataFrame for updates (vectorized with Pandas).Uses a cursor-based approach (UpdateCursor), modifying records row by row.
SpeedFaster for large batch updates (leverages NumPy, vectorized operations).Slower for large datasets due to row-by-row processing but scales well with large file geodatabases.
Memory UsageHigher, since it loads the entire dataset into memory.Lower, as it processes one row at a time and writes directly to disk.
Ease of UseSimpler, using Pandas-like syntax.More complex, requiring explicit cursor handling.
Parallel ProcessingCan use multiprocessing/Dask to improve performance.Limited, but ArcGIS Pro supports some multiprocessing tools.
Spatial Database SupportWorks well with PostGIS, SpatiaLite, and other open formats.Optimized for Esri File Geodatabases (.gdb) and enterprise databases.
File Format CompatibilityReads/writes GeoJSON, Shapefiles, Parquet, etc.Reads/writes File Geodatabase, Shapefile, Enterprise Databases.

5. When to Use ArcPy Instead

There are still times that using ArcPy would be the better solution. Things like network analysis, topology validation, or tasks that require a deeper integration with ArcGIS Enterprise in some other capacity are better done in ArcPy as opposed to GeoPandas. In the case of network analysis, ArcPy integrates ArcGIS’s native network analyst extension. On its own, it supports finding the shortest path between locations, calculating service areas, origin-destination cost analysis, vehicle routing problems, and closest facility analysis. It also works natively with ArcGIS’s advanced network datasets such as turn restrictions, traffic conditions, one-way streets, and elevation-based restrictions. 

6. Conclusion

GeoPandas offer greater efficiency, speed, flexibility, and simplicity when working with open-source tools in ArcGIS workflows, especially with regard to custom analysis and preprocessing. If you haven’t tried using GeoPandas before, it is more than worth your time to play around with. 

Have you had your own positive or negative experiences using GeoPandas with ArcGIS? Feel free to leave them in the comments, or give us a suggestion of other workflows you would like to see a blog post about! 

Applying Porter’s Five Forces to Open-Source Geospatial

Introduction

The geospatial industry has seen significant transformation with the rise of open-source solutions. Tools like QGIS, PostGIS, OpenLayers, and GDAL have provided alternatives to proprietary GIS software, providing cost-effective, customizable, and community-driven mapping and spatial analysis capabilities. While open-source GIS thrives on collaboration and accessibility, it still operates within a competitive landscape influenced by external pressures.

Applying Porter’s Five Forces, a framework for competitive analysis developed by Michael E. Porter in 1979, allows us to analyze the industry dynamics and understand the challenges and opportunities open-source GIS solutions face. The five forces include the threat of new entrants, bargaining power of suppliers, industry rivalry, bargaining power of buyers, and the threat of substitutes. We will explore how these forces shape the world of open-source geospatial technology.

Porter’s Five Forces was conceived to analyze traditional market-driven dynamics. While open-source software development is not necessarily driven by a profit motive, successful open-source projects require thriving, supportive communities. Such communities still require resources – either money or, even more importantly and scarce, time. As a result, a certain amount of market thinking can be useful when considering adoption of open-source into your operations or starting a new project.

Porter articulated the five forces in terms of “threats” and “power” and “rivalry.” We have chosen to retain that language here for alignment with the model but, in the open-source world, many of these threats can represent opportunities for greater collaboration.

1. Threat of New Entrants: Low to Moderate

The barriers to entry in open-source geospatial solutions are low for basic tool development compared to proprietary software development. Developers can utilize existing open-source libraries, open geospatial data, and community-driven documentation to build new tools with minimal investment.

However, gaining significant adoption or community traction presents higher barriers than described in traditional new entrant scenarios. Well-established open-source solutions like QGIS, PostGIS, and OpenLayers have strong community backing and extensive documentation, making it challenging for new entrants to attract users.

New players may find success by focusing on novel or emerging use case areas like AI-powered GIS, cloud-based mapping solutions, or real-time spatial analytics. Companies that provide specialized integrations or enhancements to existing open-source GIS tools may also gain traction. DuckDB and its edge-deployability is a good example of this.

While new tools are relatively easy to develop, achieving broad community engagement often requires differentiation, sustained innovation, and compatibility with established standards and ecosystems.

2. Bargaining Power of Suppliers: Low to Moderate

Unlike proprietary GIS, where vendors control software access, open-source GIS minimizes supplier dependence due to its open standards and community-driven development. The availability of open geospatial datasets (e.g., OpenStreetMap, NASA Earthdata, USGS) further reduces the influence of traditional suppliers.

Moderate supplier power can arise in scenarios where users depend heavily on specific service providers for enterprise-level support, long-term maintenance, or proprietary enhancements (e.g., enterprise hosting or AI-powered extensions). Companies offering such services, like Red Hat’s model for Linux, could gain localized influence over organizations that require continuous, tailored support.

However, competition among service providers ensures that no single vendor holds significant leverage. This can work to the benefit of users, who often require lifecycle support. Localized supplier influence can grow in enterprise settings where long-term support contracts are critical, making it a consideration in high-complexity deployments.

3. Industry Rivalry: Moderate to High

While open-source GIS tools are developed with a collaborative ethos, competition still exists, particularly in terms of user adoption, funding, and enterprise contracts. Users typically don’t choose multiple solutions in a single category, so a level of de facto competition is implied even though open-source projects don’t explicitly and directly compete with each other in the same manner as proprietary software.

  • Open-source projects compete for users: QGIS, GRASS GIS, and gvSIG compete in desktop GIS; OpenLayers, Leaflet, and MapLibre compete in web mapping.
  • Enterprise support: Companies providing commercial support for open-source GIS tools compete for government and business contracts.
  • Competition from proprietary GIS: Esri, Google Maps, and Hexagon offer integrated GIS solutions with robust support, putting pressure on open-source tools to keep innovating.

However, open-source collaboration reduces direct rivalry. Many projects integrate with one another (e.g., PostGIS works alongside QGIS), creating a cooperative rather than competitive environment. While open-source GIS projects indirectly compete for users and funding, collaboration mitigates this and creates shared value. 

Emerging competition from cloud-native platforms and real-time analytics tools, such as SaaS GIS and geospatial AI services, increases rivalry. As geospatial technology evolves, integrating AI and cloud functionalities may determine long-term competitiveness.

When looking to adopt open-source, consider that loose coupling through the use of open standards can add greater value. When considering starting a new open-source project, have integration and standardization in mind to potentially increase adoption.

4. Bargaining Power of Buyers: Moderate

In the case of open-source, “bargaining” refers to the ability of the user to switch between projects, rather than a form of direct negotiation. The bargaining power of buyers in the open-source GIS space is significant, primarily due to the lack of upfront capital expenditure. This financial flexibility enables users to explore and switch between tools without major cost concerns. While both organizational and individual users have numerous alternatives across different categories, this flexibility does not necessarily translate to strong influence over the software’s development.

Key factors influencing buyer power:

  • Minimal financial lock-in: In the early stages of adoption, users can easily migrate between open-source tools. However, as organizations invest more time in customization, workflow integration, and user training, switching costs increase, gradually reducing their flexibility.
  • Community-driven and self-support options: Buyers can access free support through online forums, GitHub repositories, and community-driven resources, lowering their dependence on paid services.
  • Customizability and adaptability: Open-source GIS software allows organizations to tailor the tools to their specific needs without vendor constraints. However, creating a custom version (or “fork”) requires caution, as it could result in a bespoke solution that the organization must maintain independently.

To maximize their influence, new users should familiarize themselves with the project’s community and actively participate by submitting bug reports, fixes, or documentation. Consistent contributions aligned with community practices can gradually enhance a user’s role and influence over time.

For large enterprises and government agencies, long-term support requirements – especially for mission-critical applications – can reduce their flexibility and bargaining power over time. This dependency highlights the importance of enterprise-level agreements in managing risk.

5. Threat of Substitutes: Moderate to High

Substitutes for open-source GIS tools refer to alternatives that provide similar functionality. These substitutes include:

  • Proprietary GIS software: Tools like ArcGIS, Google Maps, and Hexagon are preferred by many organizations due to their perceived stability, advanced features, and enterprise-level support.
  • Cloud-based and SaaS GIS platforms: Services such as Felt, MapIdea, Atlas, Mapbox, and CARTO offer user-friendly, web-based mapping solutions with minimal infrastructure requirements.
  • Business Intelligence (BI) and AI-driven analytics: Platforms like Tableau, Power BI, and AI-driven geospatial tools can partially or fully replace traditional GIS in certain applications.
  • Other open-source GIS tools: Users can switch between alternatives like QGIS, GRASS, OpenLayers, or MapServer with minimal switching costs.

However, open-source GIS tools often complement rather than fully replace proprietary systems. For instance, libraries like GDAL and GeoPandas are frequently used alongside proprietary solutions like ArcGIS. Additionally, many SaaS platforms incorporate open-source components, offering organizations a hybrid approach that minimizes infrastructure investment while leveraging open-source capabilities.

The emergence of AI-driven spatial analysis and real-time location intelligence platforms is increasingly positioning them as partial substitutes to traditional GIS, intensifying this threat. As these technologies mature, hybrid models integrating both open-source and proprietary elements will become more common.

Conclusion

Porter’s Five Forces analysis reveals that open-source geospatial solutions exist in a highly competitive and evolving landscape. While they benefit from free access, strong community support, and low supplier dependence, they also face competition from proprietary GIS, SaaS-based alternatives, and substitutes like AI-driven geospatial analytics.

To remain competitive, open-source GIS projects must not only innovate in cloud integration and AI-enhanced spatial analysis but also respond to the shifting landscape of real-time analytics and SaaS-based delivery models. Strengthening enterprise support, improving user-friendliness, and maintaining strong community engagement will be key to their long-term sustainability.

As geospatial technology advances, open-source GIS will continue to play a crucial role in democratizing access to spatial data and analytics, offering an alternative to fully proprietary systems while fostering collaboration and technological growth.

To learn more about how Cercana can help you develop your open-source geospatial strategy, contact us here.

Developing a Geospatially-Aware Strategic Plan for Your Organization

What is Strategic Planning and Why Does it Matter?

Strategic planning is one of the most important things you can do for your organization. It helps you not only paint the picture of where you want your organization to be in the future, but also draws the roadmap for how you’re going to get there. 

Having goals is crucial for any business. Companies generally don’t thrive and grow by accident. However, having those goals is only the first step. You need to know what the steps to reaching them are, what challenges lie in the way, and what you’re going to do when those challenges arise. The better your plans, the quicker you can address the challenges.

Key Factors in Developing a Strategic Plan

It is equally important to know both where you want your organization to be in five years as well as next year. Your short-term goals will act as checkpoints along the journey to your long-term goals. While articulating these, you’ll want to make sure to craft a clear mission statement to help bring your entire organization into alignment on where the ship is trying to steer and why.

Geospatial tools can be helpful in accomplishing your goals. There are a variety of ways they can help you provide useful insights that support your organization’s operations. Geospatial tools can help you determine the best areas for expansion, understand your supply chains in greater depth, reveal location-based trends in your consumers, and so much more. The more exact your understanding of your business and customers is, the more sure you can be in your next steps and your plan. 

A key step in formulating your strategic plan is conducting a SWOT analysis. All four components – your strengths, weaknesses, opportunities, and threats – can be examined in greater depth through geospatial insights. 

If one of your strengths is a particular location of your operations, there are many geospatial factors that can be contributing to that. Spatial analysis using demographic data such as census blocks and local parcel data can help you understand the population within proximity to the store. This information can be used to characterize new locations with similar populations. Geospatial tools can create an easily understood map that helps your leadership visualize results without having to sift through pages and pages of data.

Perhaps a weakness of your operation is high distribution cost and long turn-around time for acquiring inventory. Geospatial tools can provide a deeper understanding of your supply chain in a manner that’s easy to understand. They can help to optimize distribution points in relation to upstream suppliers and downstream retail locations. It can also help to identify gaps that may require new supplier relationships to fill.

When analyzing the opportunities, understanding geospatial factors can help capitalize on them. If you want to expand your operations in the Northeast, a geospatial analysis of commercial locations could tell you what parcels are ideal to target based on municipal taxes, proximity to distribution channels, demographic make-up for sourcing labor and finding consumers, and environmental factors such as frequency of natural disasters. 

Similar analysis can help identify potential threats that may have been previously unrecognized. As you’re looking at expanding in the Northeast, perhaps you notice there’s a very limited number of properties that ideally suit your needs, and the majority of them that exist are already owned by one of your competitors. This presents you with an opportunity to reassess your market entry strategy. 

Devise a Strategy

After completing your SWOT analysis, you’ll want to put pen to paper on your strategic plan. Be sure to make the steps in your plan actionable, clear, and measurable. Your steps and strategies should align with your organization’s values and mission statement. Incorporating geospatial analysis into your plan of action is important, as well. Geospatial insights can provide excellent visualizations of data and progress towards your goals. 

Execute Your Strategy

Executing a strategic plan across all business departments ensures alignment, efficiency, and goal achievement. Effective communication fosters collaboration, breaking down silos between teams. Proper resource allocation optimizes budgets, personnel, and technology, preventing inefficiencies. A well-integrated plan leverages geospatial skills and tools, placing them where they add the most value—whether in logistics, marketing, or risk assessment. 

This enhances decision-making, improves operational efficiency, and boosts competitiveness. Geospatial insights drive location-based strategies, ensuring businesses optimize site selection, route planning, and customer targeting. A strategic, cross-departmental approach maximizes the impact of geospatial tools, leading to smarter business decisions and sustainable growth.

Evaluate and Control

Monitoring progress on a strategic plan requires tracking KPIs to measure success and identify areas for improvement. Geospatial KPIs, such as delivery efficiency, store performance by location, or market penetration, provide location-based insights to optimize decisions. Regular analysis ensures alignment with business goals, allowing for timely adjustments. By leveraging real-time geospatial data, businesses can refine strategies, improve resource allocation, and adapt to changing market conditions for sustained success.

Common Challenges and Solutions

Change is often met with uncertainty. It’s important to foster a culture of open communication and honesty about the direction of the organization with all your players on all levels of all departments in order to get everyone on the same page. Here, geospatial analysis can contribute to ensuring that decisions are data-driven. Maps are a great communication tool for aligning your organization around your goals.

Another common problem with effective implementation of a strategic plan is working with inadequate data. Data collection has to be the number one priority of your organization at all levels in order to ensure that data-driven decisions can be made accurately and effectively. In a geospatial context, ensuring that all tools being used enable location as a first-class citizen is paramount. This way, all data collected is location aware from the onset of your plan’s implementation. 

Commonly, geospatial tools and data are stovepiped and underutilized. Modern geospatial systems can live side-by-side with other line-of-business tools used in strategic planning and monitoring, such as ERP and CRM. It is no longer necessary to have fully dedicated geospatial tools and expertise that resides outside of mainstream business systems. Ensuring that geospatial analysis is tightly integrated will help ensure that strategic data-driven decisions are also location-aware.

Conclusion

Most organizations understand how location affects their operation, but the cost and effort of integrating geospatial analysis into strategic decision-making is often seen as too high. Modern geospatial tools and practices, when deployed in targeted ways, can ensure that location is properly accounted for in goal-setting and execution. If you’d like to learn more about how Cercana can help you maximize the value of location in your strategic planning, contact us here.

Geospatial Portfolio Management and Rationalization

Many organizations rely on geospatial technology to derive insights based on location and spatial relationship. Whether they are mapping infrastructure, analyzing environmental changes, or optimizing logistics, managing geospatial investments effectively is imperative. Two strategies, IT portfolio management and IT rationalization, can help organizations maximize the value of their geospatial assets while reducing inefficiencies. Leveraging the right tools and techniques ensures these strategies are implemented effectively.

When we talk about “geospatial investments,” we are talking about infrastructure, software, and data. Assets in those categories may be acquired through proprietary licenses, subscriptions such as SaaS or DaaS, or by onboarding open-source solutions. Regardless of the provenance of the asset, its acquisition and incorporation into operations brings costs that must be managed like any other investments.

What Is IT Portfolio Management?

IT portfolio management is a structured process for evaluating and aligning IT assets, including geospatial tools and data, with organizational goals. Think of it like managing a financial portfolio—prioritizing investments to maximize returns while managing risks.

In practice, effective IT portfolio management involves a combination of strategic planning, resource allocation, and continuous assessment. Organizations leverage portfolio management to ensure IT investments, including geospatial tools and data, align with long-term objectives while remaining adaptable to changing priorities. This often entails mapping projects to business outcomes, identifying dependencies, and evaluating performance metrics to measure success. Additionally, fostering collaboration between IT and operational teams enhances decision-making, ensuring geospatial initiatives address both technical and organizational needs. By applying these principles, organizations can maximize the value of their geospatial assets while mitigating risks associated with resource misallocation or misaligned goals.

Tools and Techniques for Geospatial Portfolio Management

  1. Portfolio Management Software:
    • Tools like Planview, SailPoint, or Smartsheet can help track geospatial technology assets. Some integrate with ERP systems to identify spend. This is useful for tracking commercial software licenses, subscriptions, and even support contracts from open-source tools. They can be especially useful for identifying “shadow IT” in which staff onboard SaaS tools and then expense the subscription fees.
    • Mobile Device Management (MDM) tools such as JAMF or JumpCloud can be effective at tracking or deploying software on managed devices. This can help with license optimization for commercial software, patch management for commercial and  open-source tools, or data inventory management at the edge.
  2. Geospatial Data Inventory:
    • Platforms like GeoNode, CKAN, or Esri’s Data Catalog helps centralize and manage spatial datasets across multiple teams and locations.
    • Search tools such as Voyager, have features that enable discovery of geospatial data and the assessment of data redundancy.
  3. Prioritization Frameworks:
    • Weighted Scoring Models enable the use of organization-specific criteria to provide consistent evaluation of alternatives.
    • Benefit-Cost Analysis provides a relatively simple way to objectively evaluate and rank geospatial investments.

By utilizing these tools and techniques, organizations can align their geospatial investments with business goals and make data-driven decisions.


What Is IT Rationalization?

IT rationalization focuses on simplifying and streamlining IT assets to eliminate redundancy and reduce costs. It requires a systematic approach to evaluate the relevance, efficiency, and performance of IT assets. It involves cataloging all technology assets, assessing their value and usage, and identifying areas of overlap or obsolescence. For geospatial technology, this process includes analyzing the lifecycle of geospatial tools, evaluating data quality and relevance, and determining the efficiency of current workflows. Organizations often use rationalization to create a unified technology ecosystem by consolidating systems, integrating data sources, and phasing out redundant or underperforming applications. This ensures that geospatial investments support operational needs while reducing costs and improving overall agility.

Geospatial rationalization involves a systematic approach to streamlining geospatial technology and data assets, ensuring they align with organizational goals while reducing inefficiencies and costs. The process begins with inventorying assets using tools like an MDM platform or Voyager, which can track software, hardware, and data. Identifying redundancies is a critical next step, where tools like FME or Voyager can uncover duplicate data for cleanup, while GDAL/OGR standardizes and consolidates diverse datasets to ensure consistency. Migration and consolidation further enhance efficiency by moving geospatial data to modern, scalable platforms like Apache Sedona with Spark, PostGIS, or a data warehouse, often leveraging ELT/ETL tools. 

Application rationalization frameworks help organizations evaluate and classify geospatial applications for retention or retirement. Finally, performance monitoring tools like ensure applications operate efficiently, allowing for proactive identification of bottlenecks and optimization of resources. Together, these steps enable organizations to create a unified, cost-effective geospatial technology ecosystem tailored to their operational needs.

Challenges of Geospatial Technology in Portfolio Management and Rationalization

Managing and rationalizing geospatial tools and data present unique challenges due to the specialized nature and complexity of these systems. For instance, the vast volumes and diverse formats of geospatial data—such as vector layers, satellite imagery, and real-time sensor feeds—require robust storage and processing solutions. Organizations often grapple with ensuring data integrity, accessibility, and compatibility, especially when datasets come in formats like shapefiles, GeoJSON, or KML. For example, a municipality managing urban planning projects might need to consolidate data from various sources into a unified format using tools like GDAL/OGR. Apache Sedona, integrated with Spark in a data lake employing a medallion architecture, provides an efficient framework for managing large-scale geospatial datasets. This architecture allows organizations to organize raw data into bronze, silver, and gold layers, enabling a scalable and structured approach to data cleansing, integration, and analysis while maintaining high performance and flexibility.

Another significant concern is aligning tools and resources with organizational priorities while managing costs and governance. Differing project requirements can lead to overlapping software tools. For example multiple desktop GIS software or mobile data collection platforms can exist across a portfolio. Additionally, ensuring data governance is important, particularly when handling sensitive geospatial information, such as infrastructure as-built data or parcel boundaries. For instance, a transportation agency may use GeoNetwork to manage metadata securely while employing encryption and role-based access controls to comply with privacy regulations. Collaboration platforms, such as ArcGIS Enterprise or GeoNode, can help bring together diverse stakeholders—urban planners, emergency responders, and environmental analysts—by centralizing geospatial data and tools, fostering better alignment, and ensuring efficient resource utilization.

Conclusion

Geospatial technology is critical for modern organizations but presents unique challenges that demand careful management. Combining geospatial tools with standard strategies for handling data volume, interoperability, and governance, organizations can streamline their geospatial systems and integrate geospatial assets into larger organizational governance frameworks. IT portfolio management and rationalization not only optimize costs but also ensure geospatial investments align with strategic goals, delivering long-term value.

To learn more about how Cercana can help you optimize your geospatial portfolio, contact us.

Hybrid Approaches to Geospatial Architectures

At Cercana, we have worked with geospatial systems that have run the gamut—from all-in proprietary stacks to pure open-source toolchains. As the technology landscape evolves, many organizations are blending both proprietary and open-source solutions. These hybrid architectures aim to capitalize on the best of each world, providing flexibility in how users store data, serve maps, run analyses, or deploy applications – but making this approach work requires thinking through a few key considerations.

Whether you’re starting from a pure proprietary environment and eyeing open-source options, or you’re heavily invested in open-source but considering some proprietary tools for specific tasks, it helps to understand where each may fit best.

The Realities of Hybrid Architecture

No two organizations have the exact same requirements. Some rely on legacy systems tied to proprietary platforms. Others have in-house developers more comfortable with taking on the full lifecycle maintenance of open-source code – which includes contributing back to projects. Others – especially in the public sector – may face strict procurement rules or governance models that dictate one approach or the other. A hybrid stack can acknowledge these constraints while providing flexibility. It says: “We’ll pick the right tool for the right job, from whatever ecosystem makes sense.”

Of course, “right tool for the right job” sounds simple. But deciding what’s “right” can be tricky.

Where Proprietary Tools Fit Well

Tightly-Coupled Stacks

One of the biggest strengths of proprietary solutions is the cohesiveness of their ecosystems. Vendors spend a lot of time enabling end-to-end data and application integration. If an organization is willing to put aside preconceived notions about the uniqueness of its workflows, it can achieve productivity quickly by simply adopting a proprietary stack and its embedded processes and methods. This approach essentially trades money for time. The organization pays the vendor on the premise that it will get up to speed quickly.

For example, Esri’s ArcGIS platform integrates desktop, server, cloud, and mobile components. If your organization leans heavily on complex, out-of-the-box analytics or well-supported data management workflows, going with this solution can shorten the learning curve. Tools like ArcGIS Pro or ArcGIS Enterprise can handle data ingestion, manage user access, provide advanced analytics, and generate polished cartography—all within a single environment.

Easily Available Support and Roadmaps

Commercial vendors often provide guaranteed support and clearly stated product roadmaps. If your organization prioritizes the idea of risk reduction, having a help desk and service-level agreement (SLA) behind you can tip the scales toward proprietary platforms.

There’s a lot to be said about the quality of help desk support, the timeliness of remedies under an SLA, and the speed and availability of things like security patches. That said, organizations that are very process-oriented place a lot of value in the existence of the agreement itself, which gives them a place to start, even if it is inefficient in execution.

User-Friendly Interfaces

This is far less of an issue than it used to be, but it is a misconception that persists among adherents to proprietary systems. There was a time when GUIs – especially on the desktop – were superior with proprietary software. Open-source was the domain of developers who were happy to work via APIs or the CLI and other such users were their target audience. That distinction has mostly evaporated – especially with the move of applications and processing to the web and cloud. The recent advent of natural-language interfaces will continue to close this gap.

Where proprietary GUIs still shine has more to do with the end-to-end workflow integration discussed earlier. Vendors do a good job of exposing tools and using consistent nomenclature throughout their stacks, which helps users follow their nose through a workflow. In ArcGIS, it is relatively easy to to chart the journey of a feature class, through to being a map package, and finally a map service exposed via ArcGIS Online.

In the end, it is important to recognize the distinction between an “interface that I know how to use” versus an “interface that is better.” Market dominance has a strong effect on perception (see Windows v. Mac, or iPhone v. any other mobile device).

Where Open-Source Tools Shine

Flexibility and Interoperability

Open-source geospatial tools often align tightly with open standards like WMS, WFS, and GeoPackage. This makes it easier to integrate with other systems, add new capabilities, or swap out components without rewriting everything. For instance, using PostGIS as your spatial database allows you to connect easily with GeoServer for serving OGC web services or with QGIS for editing and analysis. Especially in geospatial, open-source tools tend to align heavily around open standards, such as those from the OGC, as a first principle. This streamlines integration of systems that are mostly developed by independent or loosely-coupled project teams.

Cost Savings and Scalability

Open-source tools don’t carry licensing fees, which can be a big plus for tight budgets. And since you can run them on your own hardware or in the cloud, scaling up often involves fewer financial hurdles. For massive datasets or complex operations, you might spin up multiple PostGIS instances or deploy a cluster of servers running GeoServer to handle load—all without worrying about additional per-core or per-seat licenses.

That said, open-source tools aren’t (or shouldn’t be) entirely free of cost. If you are using open-source and deriving business value from it, you should contribute back in some way. That can take many forms. You can let your staff spend part of their time developing enhancements to open-source code, documentation, or tests that can be contributed back. You could at least partially employ someone who maintains projects that you use. You could simply donate funds to projects. Regardless of how you choose to support open-source, there will be a cost, but it will most likely be far less than what you’d spend on a per-seat/core/whatever licensing model.

Finally, organizations can procure support for open-source tools from third parties who often employ maintainers. This begins to approach the help-desk/SLA model discussed above in relation to proprietary systems. It is often not an exact match for that model, but it is a good way for an organization that doesn’t think of software as its “day job” to simultaneously get support and contribute back to the open-source from which it derives value.

Deep Customization

Because the code is open, if you have development resources, you can tailor these tools to your exact needs. We’ve seen teams customize QGIS plugins to automate their entire workflow or tweak GeoServer configurations for specialized queries. You’re not stuck waiting for a vendor to implement that one feature you need.

That said, think through how you approach such customizations before you jump in. The moment you fork a project and change its core code, you own it – especially if the maintainers reject your changes. You’ll want to think about a modular approach that isolates your changes in a way that leaves you able to continue to receive updates to the core code from the maintainers while preserving your customizations. QGIS is a great example – build a plug-in rather than changing the QGIS code itself. Many open-source geospatial tools have extensible models – like GDAL or GeoServer. Understand how those work and have a plan for your customizations before you get going on them.

Taking a Hybrid Approach

A hybrid architecture tries to find balance. Consider the following patterns that we’ve seen work well:

Pattern 1: Proprietary Desktop + Open-Source Backend

In this scenario, you might run ArcGIS Pro for your cartographic and analytic workflows—especially if your staff is well-versed in it—while managing all your spatial data in PostGIS. You maintain the user-friendly environment that your team knows, but you also gain the scalability and interoperability of a robust spatial database. ArcGIS Pro can connect to PostGIS tables, perform analyses, and visualize results. Meanwhile, data integration and sharing can happen through open formats and APIs.

Pattern 2: Open-Source Desktop + Proprietary Web Services

This might sound like a twist, but we’ve seen teams rely on an open-source desktop tool like QGIS while they serve their data through a proprietary server product or a cloud-based hosted solution. Perhaps your organization invested heavily in a proprietary web platform (like ArcGIS Enterprise) that integrates with enterprise user management, security, and BI tools. QGIS users can consume services from that server, taking advantage of familiar open-source editing tools while benefiting from a managed, well-supported data environment.

Pattern 3: Proprietary Spatial Analysis + Open-Source Front-Ends

If you’re dealing with complex spatial modeling—maybe you’re working with advanced network analysis or 3D analytics that a proprietary tool excels at—you can still present and distribute those results through open-source web maps or dashboards. For example, run your analysis in ArcGIS Pro or FME, then publish the output as a service via GeoServer and visualize it in a Leaflet-based web app. Now your end users interact through a lightweight, custom UI that’s easy to update.

Pattern 4: Open-Source Core with Proprietary Add-Ons

Alternatively, your core environment might be open-source—PostGIS for data storage, QGIS for editing, GeoServer for OGC services—but maybe you integrate a proprietary imagery analysis tool because it handles specific sensor data or advanced machine learning models out-of-the-box. This “best-of-breed” approach can deliver specialized capabilities without forcing your entire stack into one ecosystem.

Key Considerations

Governance and Security

A hybrid environment means more moving parts. You’ll need clear policies on data governance, security practices, version control, and how updates get rolled out. Vetting open-source tools for security and licensing compliance is essential, as is ensuring that proprietary components don’t introduce unexpected vendor constraints. 

There are two important points here. The first is that open-source is not less secure than proprietary software – in fact, it is often demonstrably more secure. Acquisition policies often (fairly or not) have extra processes for the use of open-source. You’ll need to be aware of how your organization approaches this. As part of that, you’ll need a plan to show how you’ll integrate security patches as they become available, since there’s usually not a vendor-provided system that automatically pushes them.

The second point is that open-source licenses are legally-binding licenses. Because you do not pay for the software does not mean the licenses do not apply. You’ll want to understand the nuances of open-source licenses (permissive vs. restrictive, copy-left, etc.) to ensure you remain compliant as you integrate open-source into your stack.

Skill Sets and Training

Your team may need to learn new tools. If everyone is fluent in ArcGIS Pro but you introduce PostGIS, you’ll need to provide SQL training. Conversely, if you bring in ArcGIS Enterprise to complement your open-source stack, your team may need guidance on navigating that environment. Don’t skimp on professional development—investing in training pays off in smoother operations down the line.

This is simply best practice in terms of lifecycle management of your technology stack. Give your staff the knowledge they need to be productive. There is ample information and training available for both proprietary and open-source geospatial tooling, so the provenance of a software solution should not affect the availability of training to get your staff up to speed.

Performance and Scalability

As you blend tools, test performance early and often. Proprietary solutions may have certain hardware recommendations or licensing constraints that impact scaling. Open-source tools can scale horizontally, but you may need devops practices to manage containers, virtual machines, security patching, or cloud deployments. Think through how you’ll handle bigger data volumes or higher user traffic before it becomes an urgent issue.

Long-Term Viability and Community Support

Open-source tools thrive on community involvement. Check activity on GitHub repos or forums—are they lively? Do updates happen regularly? Proprietary vendors usually maintain formal roadmaps and documentation. Balancing these factors ensures you’re not tied to a dead-end project or a product that doesn’t meet your evolving needs.

Wrapping Up

We’re long past the days when an all-in proprietary approach was the only game in town. At the same time, not everyone is ready (or able) to go fully open-source. A hybrid architecture acknowledges that each technology ecosystem brings something different to the table, and there is value in mixing and matching.

If you want stable support and integrated workflows right out of the box, proprietary tools might be your go-to. If you’re looking to scale rapidly, and stay agile, open-source solutions are hard to beat. Most organizations find themselves somewhere in between. By thoughtfully picking where you deploy proprietary versus open-source tools, you can build a geospatial architecture that’s both pragmatic and innovative—ready for whatever challenges (and opportunities) lie ahead.

To learn more about how Cercana can help you optimize your geospatial architecture, contact us.

Integrating AI Into Geospatial Operations

At Cercana, we’re excited by the constant evolution of geospatial technology. AI and its related technologies are becoming increasingly important components of geospatial workflows. Recently, our founder, Bill Dollins, has shared some of his explorations into AI through his personal blog, geoMusings, where he has written about topics like Named Entity Recognition (NER), image similarity using pgVector, and retrieval-augmented generation (RAG). These explorations reflect Cercana’s commitment to helping our clients understand emerging technologies and consider how best to integrate them into their operations.

Coarse Geocoding with ChatGPT

In his May 2024 post, Bill explored the application of ChatGPT for Named Entity Recognition (NER), a vital tool in the AI toolkit. NER can extract key information from unstructured text, such as identifying people, locations, and organizations. At Cercana Systems, we see potential in using AI to streamline geospatial data processing, particularly in the context of large-scale data integration tasks. By using AI tools like ChatGPT, we can automate the extraction of spatial information from textual data, making it easier for our clients to analyze and take action.

This capability is particularly relevant in scenarios where large volumes of data need to be sifted through quickly—whether for real-time monitoring or in-depth analysis. As we continue to refine our capabilities, Cercana is positioned to offer more precise and scalable solutions.

Exploring Image Similarity with pgVector

In a July 2024 post, Bill explored analyzing image similarity using pgVector, a vector database extension for PostgreSQL. This post examines the creation of direct vector embeddings from images, rather than solely using image metadata such as EXIF tags. Combined with such metadata, including location, direct embeddings enable a more discreet kind of “looks like” analysis on a corpus of images.

By integrating pgVector with existing geospatial data pipelines, we are enhancing our ability to process and analyze visual data more efficiently. This capability not only speeds up workflows but also opens new avenues for our clients to derive actionable insights from their image datasets.

Experimenting with RAG Using ChatGPT and DuckDuckGo

Most recently, in August 2024, Bill explored the concept of retrieval-augmented generation (RAG) by combining ChatGPT with DuckDuckGo for information retrieval. RAG models are a quickly-developing capability in AI because they blend the generative capabilities of models like LLMs with the precision of traditional search engines and database queries. This fusion enables more accurate and contextually relevant information retrieval, which can be valuable for analytical tasks and other data-intensive operations.

At Cercana, we’re looking at RAG to enable AI-enhanced geospatial solutions. By integrating RAG, we seek to provide clients with more discreet, context-aware tools that can make sense out of large volumes of unstructured data.

Moving Forward

As Cercana grows and evolves, we are finding new ways of integrating AI into our geospatial services. Bill’s explorations into NER, image similarity, and RAG are examples of this. We believe that AI tools and related technologies, when paired with more traditional tools such as data pipelines and geospatial databases, provide the opportunity to improve data quality and shorten the time-to-market for actionable information.

To learn more about how Cercana can help you integrate AI into your operations, please contact us.

Choosing Between an iPaaS and Building a Custom Data Pipeline

In today’s data-driven world, integrating various systems and managing data effectively is crucial for organizations to make informed decisions and remain responsive. Two popular approaches to data integration are using an Integration Platform as a Service (iPaaS) or building a custom data pipeline. Each approach has its advantages and challenges, and the best choice depends on your organization’s specific needs, resources, and strategic goals.

Understanding iPaaS

An iPaaS is a hosted platform that provides a suite of tools to connect various applications, data sources, and systems, both within the cloud and on-premises. It enables businesses to manage and automate data flows without the need for extensive coding, offering pre-built connectors, data transformation capabilities, and support for real-time integration.

For example, the image below shows an integration done in FME, an iPaaS that is commonly used in geospatial environments but has native support for common non-spatial platforms such as Salesforce. This integration creates a Jira ticket each time a new Salesforce opportunity object is created. It also posts notifications to Slack to ensure the new tickets are visible to assignees.

iPaas Salesforce-to-Jira pipeline in FME

This integration illustrates the typical visual nature of the iPaaS design approach, where flows and customizations are designed primarily through configurations, rather than through the development of custom code. This low-code approach is one of the primary value propositions of iPaaS solutions.

Advantages of iPaaS:

  • Speed and Agility: Quick setup and deployment of integrations with minimal coding required.
  • Scalability: Easily scales to accommodate growing data volumes and integration needs.
  • Reduced Maintenance: The iPaaS provider manages the infrastructure, ensuring high availability and security.

Challenges of iPaaS:

  • Limited Customization: While iPaaS solutions are flexible, there may be limitations to how much the integrations can be customized to meet unique business requirements.
  • Subscription Costs: Ongoing subscription fees can add up, especially as your integration needs grow.

Building a Custom Data Pipeline

Creating a custom data pipeline involves developing a bespoke solution tailored to your specific data integration and management needs. This approach allows for complete control over the data flow, including how data is collected, processed, transformed, and stored. This will typically be done using a mix of tools such as Python, serverless functions, and/or SQL.

Advantages of Custom Data Pipelines:

  • Complete Customization: Tailor every aspect of your data pipeline to fit your business’s unique needs.
  • Integration Depth: Address complex or unique integration scenarios that off-the-shelf solutions cannot.
  • Ownership and Control: Full ownership of your integration solution, allowing for adjustments and optimizations as needed.

Challenges of Custom Data Pipelines:

  • Higher Costs and Resources: Significant upfront investment in development, plus ongoing costs for maintenance, updates, and scaling. Proper cost modeling over a reasonable payback period can give a more accurate picture of costs. Many costs will be fixed and may dilute as your organization scales when compared to iPaaS consumption pricing.
  • Longer Time to Market: Development and testing of a custom solution can be time-consuming.
  • Expertise Required: Need for skilled developers with knowledge in integration patterns and technologies.

Making the Choice

When deciding between an iPaaS and building a custom data pipeline, consider the following factors:

  • Complexity of Integration Needs: For complex, highly specialized integration requirements, a custom pipeline might be necessary. For more standardized integrations, an iPaaS could suffice. For example, an ELT pipeline may lend itself more to an iPaaS since transformations will be performed after your data reaches its desitnation.
  • Resource Availability: Do you have the in-house expertise and resources to build and maintain a custom pipeline, or would leveraging an iPaaS allow your team to focus on core business activities? Opportunity cost related to custom development should be considered over the development period.
  • Cost Considerations: Evaluate the total cost of ownership (TCO) for both options, including upfront development costs for a custom solution versus ongoing subscription fees for an iPaaS. iPaaS tytpically has lower upfront onboarding costs than custom development, but long-term costs can rise as your organization scales.
  • Scalability and Flexibility: Consider your future needs and how each option would scale with your business. An iPaaS might offer quicker scaling, while a custom solution provides more control over scaling components.

Conclusion

Ultimately, the decision between an iPaaS and a custom data pipeline is not one-size-fits-all. It requires a strategic evaluation of your current and future integration needs, available resources, and business objectives. By carefully weighing these factors, you can choose the path that best supports your organization’s data integration and management goals, enabling seamless data flow and informed decision-making.

Contact us to learn more about our services and how we can help turn your data integration challenges into opportunities.

Using Hstore to Analyze OSM in PostgreSQL

OpenStreetMap (OSM) is a primary authoritative source of geographic information, offering a variety of community-validated feature types. However, efficiently querying and analyzing OSM poses unique challenges. PostgreSQL, with its hstore data type, can be a powerful tool in the data analyst’s arsenal.

Understanding hstore in PostgreSQL

Before getting into the specifics of OpenStreetMap, let’s understand the hstore data type. Hstore is a key-value store within PostgreSQL, allowing data to be stored in a schema-less fashion. This flexibility makes it ideal for handling semi-structured data like OpenStreetMap.

Setting Up Your Environment

To get started, you’ll need a PostgreSQL database with PostGIS extension, which adds support for geographic objects. You will also need to add support for the hstore type. Both PostGIS and hstore are installed as extensions. The SQL to install them is:

create extension postgis;
create extension hstore;

After setting up your database, import OpenStreetMap data using tools like osm2pgsql, ensuring to import the data with the hstore option enabled. This step is crucial as it allows the key-value pairs of OSM tags to be stored in an hstore column. Be sure to install osm2pgsql using the instructions for your platform.

The syntax for importing is as follows:

osm2pgsql -c -d my_database -U my_username -W -H my_host -P my_port --hstore my_downloaded.osm

Querying OpenStreetMap Data

With your data imported, you can now unleash the power of hstore. Here’s a basic example: Let’s say you want to find all the coffee shops in a specific area. The SQL query would look something like this:

SELECT name, tags
FROM planet_osm_point
where name is not null
and tags -> 'cuisine' = 'pizza'

This query demonstrates the power of using hstore to filter data based on specific key-value pairs (finding pizza shops in this case).

Advanced Analysis Techniques

While basic queries are useful, the real power of hstore comes with its ability to facilitate complex analyses. For example, you can aggregate data based on certain criteria, such as counting the number of amenities in a given area or categorizing roads based on their condition.

Here is an example that totals the sources for each type of cuisine available in Leonardtown, Maryland:

SELECT tags -> 'cuisine' AS amenity_type, COUNT(*) AS total
FROM planet_osm_point
WHERE tags ? 'cuisine'
AND ST_Within(ST_Transform(way, 4326), ST_MakeEnvelope(-76.66779675183034, 38.285044882153485, -76.62251613561185, 38.31911201477845, 4326))
GROUP BY tags -> 'cuisine'
ORDER BY total DESC;

The above query combines hstore analysis with a PostGIS function to limit the query to a specific area. The full range of PostGIS functions can be used to perform spatial analysis in combination with hstore queries. For instance, you could analyze the spatial distribution of certain amenities, like public toilets or bus stops, within a city. You can use PostGIS functions to calculate distances, create buffers, and perform spatial joins.

Performance Considerations

Working with large datasets like OpenStreetMap can be resource-intensive. Indexing your hstore column is crucial for performance. Creating GIN (Generalized Inverted Index) indexes on hstore columns can significantly speed up query times.

Challenges and Best Practices

While hstore is powerful, it also comes with challenges. The schema-less nature of hstore can lead to inconsistencies in data, especially if the source data is not standardized. It’s important to clean and preprocess your data before analysis. OSM tends to preserve local flavor in attribution, so a good knowledge of the geographic area you are analyzing will help you be more successful when using hstore with OSM.

Conclusion

The PostgreSQL hstore data type is a potent tool for analyzing OpenStreetMap data. Its flexibility in handling semi-structured data, combined with the spatial analysis capabilities of PostGIS, makes it an compelling resource for geospatial analysts. By understanding its strengths and limitations, you can harness the power of PostgreSQL and OpenStreetMap in your work.

Remember, the key to effective data analysis is not just about choosing the right tools but also understanding the data itself. With PostgreSQL and hstore, you are well-equipped to extract meaningful insights from OpenStreetMap data.

Contact us to learn more about our services and how we can help turn your geospatial challenges into opportunities.

Do You Need a Data Pipeline?

Do you need a data pipeline? That depends on a few things. Does your organization see data as an input into its key decisions? Is data a product? Do you deal with large volumes of data or data from disparate sources? Depending on the answers to these and other questions, you may be looking at the need for a data pipeline. But what is a data pipeline and what are the considerations for implementing one, especially if your organization deals heavily with geospatial data? This post will examine those issues.

A data pipeline is a set of actions that extract, transform, and load data from one system to another. A data pipeline may be set up to run on a specific schedule (e.g., every night at midnight), or it might be event-driven, running in response to specific triggers or actions. Data pipelines are critical to data-driven organizations, as key information may need to be synthesized from various systems or sources. A data pipeline automates accepted processes, enabling data to be efficiently and reliably moved and transformed for analysis and decision-making.

A data pipeline can start small – maybe a set of shell or python scripts that run on a schedule – and it can be modified to grow along with your organization to the point where it may be driven my a full-fledged event-driven platform like AirFlow or FME (discussed later). It can be confusing, and there are a lot of commercial and open-source solutions available, so we’ll try to demystify data pipelines in this post.

Geospatial data presents unique challenges in data pipelines. Geospatial data are often large and complex, containing multiple dimensions of information (geometry, elevation, time, etc.). Processing and transforming this data can be computationally intensive and may require significant storage capacity. Managing this complexity efficiently is a major challenge. Data quality and accuracy is also a challenge. Geospatial data can come from a variety of sources (satellites, sensors, user inputs, etc.) and can be prone to errors, inconsistencies, or inaccuracies. Ensuring data quality – dealing with missing data, handling noise and outliers, verifying accuracy of coordinates – adds complexity to standard data management processes.

Standardization and interoperability challenges, while not unique to geospatial data, present additional challenges due to the nature of the data. There are many different formats, standards, and coordinate systems used in geospatial data (for example, reconciling coordinate systems between WGS84, Mercator, state plane, and various national grids). Transforming between these can be complex, due to issues such as datum transformation. Furthermore, metadata (data about the data) is crucial in geospatial datasets to understand the context, source, and reliability of the data, which adds another layer of complexity to the processing pipeline.

While these challenges make the design, implementation, and management of data pipelines for geospatial data a complex task, they can provide significant benefits to organizations that process large amounts of geospatial data:

  • Efficiency and automation: Data pipelines can automate the entire process of data extraction, transformation, and loading (ETL). Automation is particularly powerful in the transformation stage. “Transformation” is a deceptively simple term for a process that can contain many enrichment and standardization tasks. For example, as the coordinate system transformations described above are validated, they can be automated and included in the transformation stage to remove human error. Additionally, tools like Segment Anything can be called during this stage to turn imagery into actionable, analyst-ready information.
  • Data quality and consistency: The transformation phase includes steps to clean and validate data, helping to ensure data quality. This can include resolving inconsistencies, filling in missing values, normalizing data, and validating the format and accuracy of geospatial coordinates. By standardizing and automating these operations in a pipeline, an organization can ensure that the same operations are applied consistently to all data, improving overall data quality and reliability.
  • Data Integration: So far, we’ve talked a lot about the transformation phase, but the extract phase provides integration benefits. A data pipeline allows for the integration of diverse data sources, such as your CRM, ERP, or support ticketing system. It also enables extraction from a wide variety of formats (shapefile, GeoParquet, GeoJSON, GeoPackage, etc). This is crucial for organizations dealing with geospatial data, as it often comes from a variety of sources in different formats. Integration with data from business systems can provide insights into performance as relates to the use of geospatial data. 
  • Staging analyst-ready data: With good execution, a data pipeline produces clean, consistent, integrated data that enables people to conduct advanced analysis, such as predictive modeling, machine learning, or complex geospatial statistical analysis. This can provide valuable insights and support data-driven decision making.

A data pipeline is first and foremost about automating accepted data acquisition and management processes for your organization, but it is ultimately a technical architecture that will be added to your portfolio. The technology ecosystem for such tools is vast, but we will discuss a few with which we have experience.

  • Apache Airflow: Developed by Airbnb and later donated to the Apache Foundation, Airflow is a platform to programmatically author, schedule, and monitor workflows. It uses directed acyclic graphs (DAGs) to manage workflow orchestration. It supports a wide range of integrations and is highly customizable, making it a popular choice for complex data pipelines. AirFlow is capable of being your entire data pipeline.
  • GDAL/OGR: The Geospatial Data Abstraction Library (GDAL) is an open-source, translator library for raster and vector geospatial data formats. It provides a unified API for over 200 types of geospatial data formats, allowing developers to write applications that are format-agnostic. GDAL supports various operations like format conversion, data extraction, reprojection, and mosaicking. It is used in GIS software like QGIS, ArcGIS, and PostGIS. As a library it can also be used in large data processing tasks and in AirFlow workflows. Its flexibility makes it a powerful component of a data pipeline, especially where support for geospatial data is required.
  • FME: FME is a data integration platform developed by Safe Software. It allows users to connect and transform data between over 450 different formats, including geospatial, tabular, and more. With its visual interface, users can create complex data transformation workflows without coding. FME’s capabilities include data validation, transformation, integration, and distribution. FME in the geospatial information market and is the most geospatially literate commercial product in the data integration segment. In addition it supports a wide range of non-spatial sources, including proprietary platforms such as Salesforce. FME has a wide range of components, making it possible for it to scale up to support enterprise-scale data pipelines.

In addition to the tools listed above, there is a fairly crowded market segment for hosted solutions, known as “integration platform as a service” or IPaaS. These platforms all generally have ready-made connectors for various sources and destinations, but spatial awareness tends to be limited, as does customization options for adding spatial. A good data pipeline is tightly coupled to the data governance procedures of your organization, so you’ll see greater benefits from technologies that allow you customize to your needs.

Back to the original question: Do you need a data pipeline? If data-driven decisions are key to your organization, and consistent data governance is necessary to have confidence in your decisions, then you may need a data pipeline. At Cercana, we have experience implementing data pipelines and data governance procedures for organizations large and small. Contact us today to learn more about how we can help you.