161 feeds monitored. Published May 15, 2026.
Executive Summary
Three themes shaped this week’s geospatial activity across policy, platform strategy, and open data.
First, sovereignty is becoming a procurement and infrastructure strategy. France’s national space strategy, India’s integrated sovereign space and geospatial infrastructure program, and Open Cosmos’s final design for an eight-satellite European Atlantic constellation all appeared in the same week. Each points to governments reducing dependence on commercial supply chains they do not control. Canada’s Strategic Geospatial newsletter made the underlying logic explicit: geography determines AI advantage, and sovereign AI requires sovereign spatial data infrastructure.
Second, Google continued to define its role in the spatial intelligence market. Its Partnership of the Year award at the Geospatial World Forum recognized an ecosystem that spans Anthropic’s Claude, Sanborn, Overture Maps, Bentley, Niantic Spatial, CARTO, and Planet. Paired with Google Earth Engine’s release of annual global commodity crop maps built on its AlphaEarth foundation model, and Overture Maps’ argument that building proprietary map data is no longer economically rational, the pattern is consistent: spatial intelligence is moving toward shared foundation infrastructure, and Google is positioning itself near the center of that system.
Third, open data is under pressure from AI. Bill Dollins at geoMusings and the Overture Maps Foundation both published substantive arguments this week about AI systems becoming a new class of open data consumer at a scale that existing infrastructure was never designed to serve. This will require policy and technical responses. Leaders with dependencies on open geospatial data should be tracking the issue closely.
Esri’s ArcGIS Pro 3.7 release and GDAL 3.13.0 “Iowa City” round out a week of activity across both commercial and open-source stacks.
Market Themes
Sovereignty Moves into Infrastructure
The sovereignty theme moved from policy language into infrastructure planning this week. Open Cosmos unveiled the final design for eight Earth observation satellites destined for the European Space Constellation for the Atlantic (ESCA), a multi-nation program intended to reduce European dependence on US and commercial EO supply chains. At the Geospatial World Forum in Amsterdam, whose awards ceremony concluded this week, France’s SGDSN took the National Space Strategy of the Year award and India’s Department of Science and Technology, alongside IN-SPACe, won the Integrated Sovereign Space and Geospatial Infrastructure award.
Meanwhile, Strategic Geospatial published a long-form analysis arguing that Canada’s sovereign AI strategy is inseparable from its geospatial data infrastructure decisions. Australia’s Spatial Source reported on domestic SAR satellite technology development moving toward production. Governments across four continents are treating geospatial infrastructure as a strategic asset requiring domestic control, not a commodity service to be purchased. Vendors with deep ties to national programs, and open-source communities that provide sovereignty-compatible alternatives to commercial platforms, are positioned to benefit.
Google’s Spatial Intelligence Ecosystem Expands
Google’s receipt of the Geospatial World Forum Partnership of the Year award describes an ecosystem that extends across several parts of the spatial intelligence stack. The award citation connects Anthropic’s Claude AI, Sanborn Map Company, Overture Maps Foundation, Bentley Systems, Niantic Spatial, CARTO, and Planet. That coalition spans AI reasoning, ground-truth data, open base maps, engineering-grade 3D infrastructure, location services, analytics, and satellite imagery.
In the same week, Google Earth Engine published annual global commodity tree crop maps covering coffee, cocoa, oil palm, and rubber, built using AlphaEarth Satellite Embedding Foundation Models. The production model is the main development: a foundation model trained on petabytes of satellite imagery generating analysis-ready outputs at continental scale.
Separately, the Overture Maps Foundation published a strategic argument that the era of companies building proprietary planetary-scale map data has ended, describing shared open data infrastructure as the rational response to the AI efficiency imperative. Taken together, these moves describe an emerging architecture: Google anchors the foundation model layer, Overture provides the shared data layer, and an expanding partner ecosystem builds domain-specific applications on top.
Open Data Faces AI-Scale Demand
Two substantive analytical pieces this week tackled the same underlying problem from different angles. Bill Dollins at geoMusings wrote directly about AI systems emerging as a new category of open data consumer, one that operates at access patterns and scales that open data programs were never designed to accommodate. The Overture Maps Foundation’s “Billion-Dollar Data Trap” post argued that the AI infrastructure arms race has made it economically irrational to maintain proprietary map datasets, implicitly pushing more organizations toward open data pools.
The same AI arms race that pushes organizations toward open data also strains open data infrastructure beyond its design parameters. This dynamic will likely require new funding models for open data programs, API throttling or licensing changes, or a distinction between AI-accessible and human-accessible open data. Organizations whose workflows depend on open geospatial data at scale should be assessing their exposure now.
ArcGIS Pro 3.7 Extends Scientific and Infrastructure Workflows
ArcGIS Pro 3.7, released Thursday, adds breadth across imagery, hydrology, nautical charting, spatial analysis, and layout workflows. The release adds new hyperspectral imagery analysis tools, a geodesic flow direction algorithm for higher-accuracy hydrological modeling, improved culvert handling in drainage workflows, native S-101 ENC nautical symbology, a weighted Voronoi spatial influence tool, a multicriteria overlay tool, and a redesigned layout interface. These arrive alongside updates to Drone2Map, ArcGIS Reality, Business Analyst, and Site Scan.
The release suggests that Esri continues to push ArcGIS Pro toward scientific-grade analysis rather than positioning it purely as a data management and visualization platform. The hyperspectral and hydrological additions, in particular, show continued investment in environmental and infrastructure verticals.
Company Activity
Product Releases
Esri: ArcGIS Pro 3.7 released with significant additions in imagery analysis, hydrological modeling, BIM/CAD interoperability, and spatial analytics. Drone2Map 2026.1 and Site Scan May 2026 updates released simultaneously, indicating a coordinated platform push.
Google Earth Engine: Released annual global commodity crop maps for coffee, cocoa, oil palm, and rubber built on AlphaEarth foundation models. This is the first production-scale demonstration of Satellite Embedding Foundation Models generating analysis-ready agricultural monitoring outputs.
GDAL / OSGeo: GDAL 3.13.0 “Iowa City” released. Details appear in the Open Source section below.
Partnerships
BAE Systems GXP × Vantor: Partnership targeting electronic warfare resilience for high-accuracy drone targeting. This reflects growing integration between defense geospatial intelligence and EW-hardened positioning, a capability gap that the Ukraine conflict exposed and that NATO procurement is now actively closing.
Telit Cinterion × Swift Navigation: Skylark GNSS correction service bundled directly into Telit’s integrated IoT positioning modules, bringing centimeter-level accuracy to industrial IoT without requiring customers to manage correction service subscriptions separately.
Spiral Blue × Arlula: Australian in-orbit processing company Spiral Blue selected Arlula’s imagery distribution platform. The deal indicates that the in-orbit processing value chain is maturing. Raw satellite data is now being processed onboard and delivered via commercial marketplaces rather than requiring ground-station ingestion and post-processing.
Funding & M&A
NEC Software Solutions UK acquires Cadcorp: NECSWS, a UK public safety technology company, acquired Cadcorp, a UK-based GIS and web mapping software provider. The strategic logic is vertical integration: NECSWS gains a native geospatial stack to embed across its emergency services and law enforcement platforms rather than depending on third-party GIS licensing. This continues the pattern of non-geospatial enterprise software firms acquiring GIS capabilities rather than licensing them.
Government and Policy
The Geospatial World Forum 2026 awards, held April 29 in Amsterdam with recognition videos posted throughout this week, provided a useful snapshot of how the international community is valuing geospatial capability. France’s SGDSN winning the National Space Strategy award reflects its 2024–2030 defense space roadmap, which treats sovereign Earth observation as a strategic enabler. India’s DST and IN-SPACe joint award for Integrated Sovereign Space and Geospatial Infrastructure shows that India’s space liberalization policy has matured into operational infrastructure at a scale that peer nations are noting. Ordnance Survey’s win as National Mapping Agency of the Year reflects both its digital transformation and its growing role as a reference model for national agencies navigating the commercial-sovereign boundary.
The OGC’s publication of openEO as an official Community Standard is a significant milestone. openEO provides a standardized API for processing large-scale Earth observation data in cloud environments, reducing the fragmentation that forces customers to rewrite analysis workflows when switching between cloud EO platforms. Standardization at the API layer commoditizes undifferentiated infrastructure. That is good for users, but challenging for platforms whose value proposition depends on lock-in.
Australia continued to surface as an active geospatial investment market, with Spatial Source reporting on domestic SAR satellite development and ICEYE publishing an emergency response resilience case study.
Technology and Research
Foundation models for Earth observation are moving into production use. Google’s AlphaEarth Satellite Embedding Foundation Models produced continental-scale commodity crop maps with annual temporal resolution, a task that previously required substantial custom model development per crop type. The Spatial Edge’s analysis this week described how AlphaEarth’s latent space captures ecological structure not present in explicit training labels. This has implications for GIS platform vendors because analytical value is being extracted at the foundation model layer before data reaches traditional GIS tooling.
GeoSpatial ML published research on Gaussian Splat-based super-resolution for Sentinel-2 imagery, an early indication that computer vision techniques from autonomous vehicles and 3D reconstruction are migrating into satellite analytics.
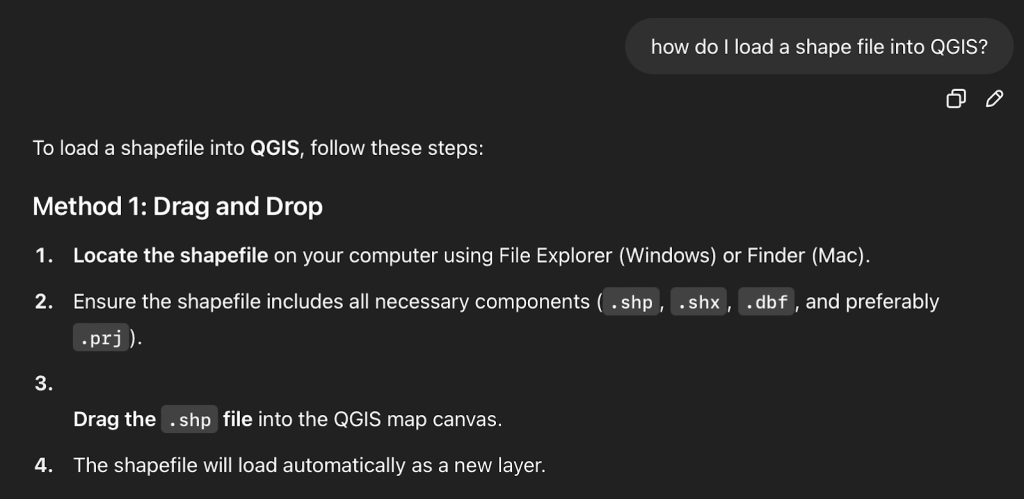
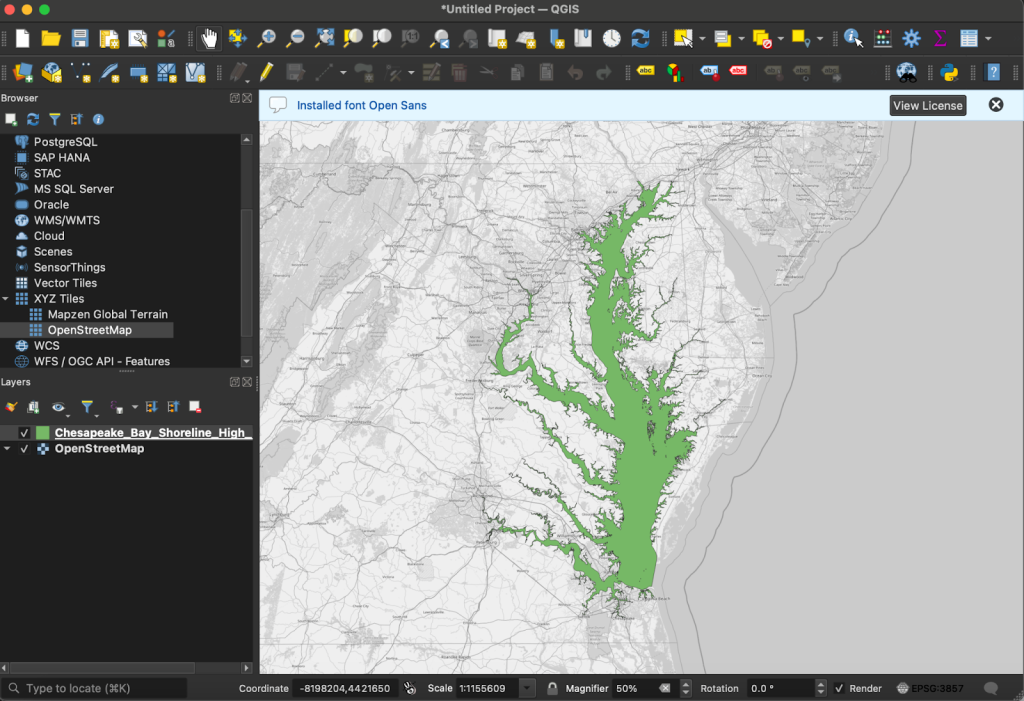
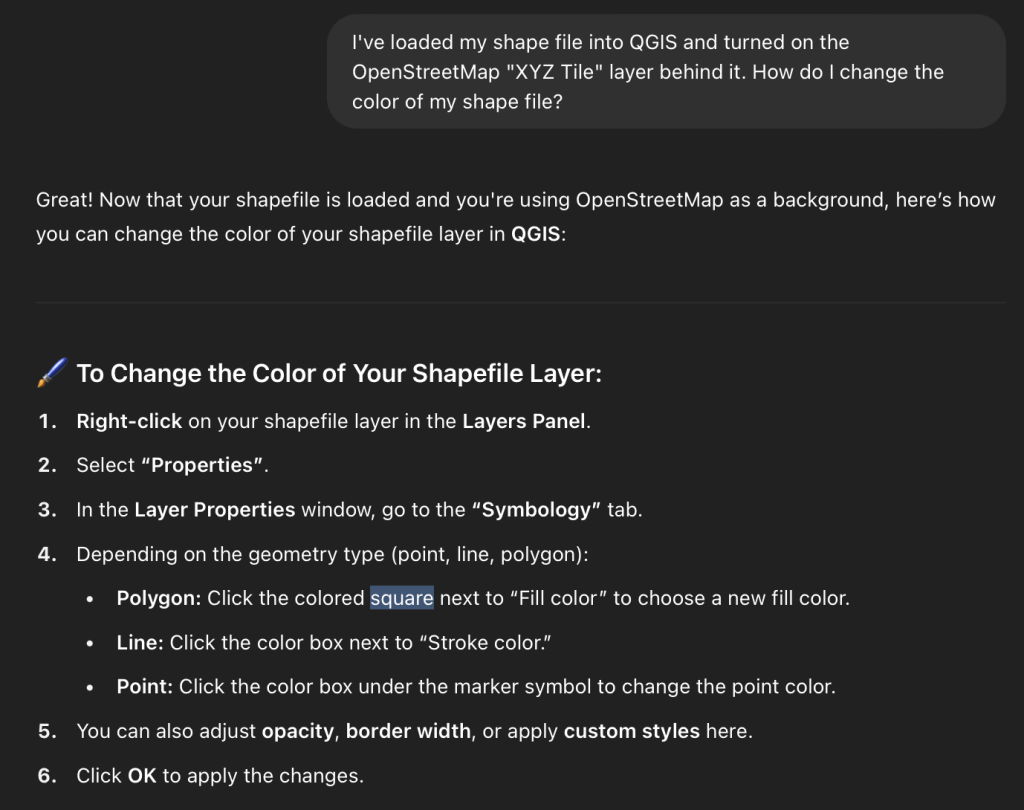
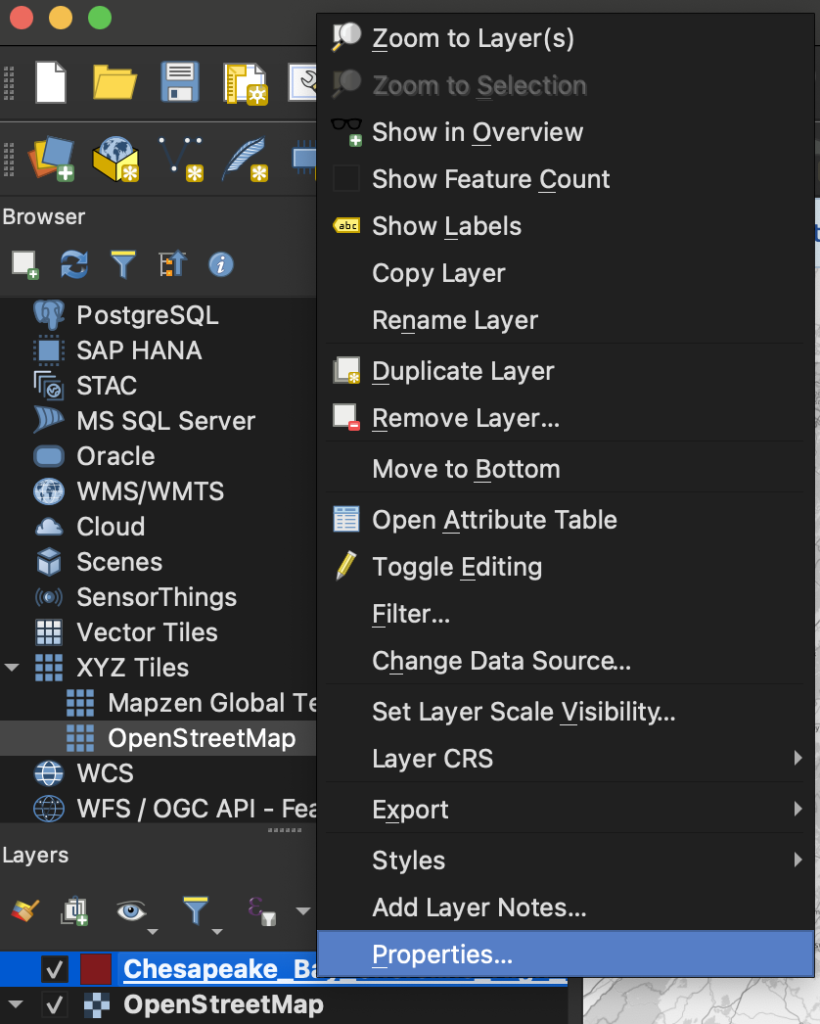
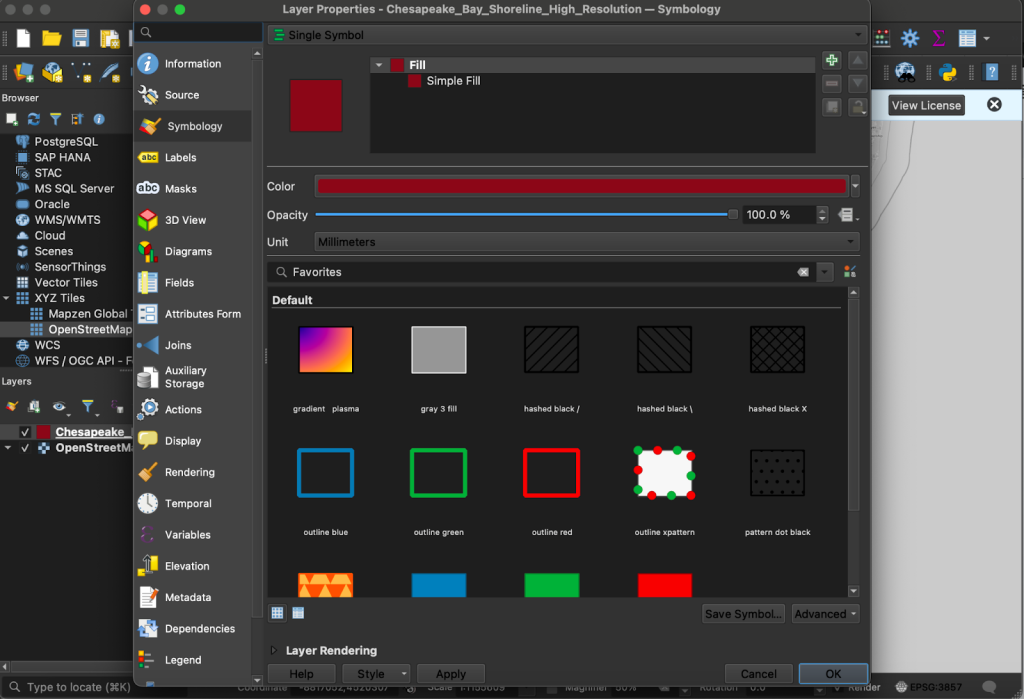
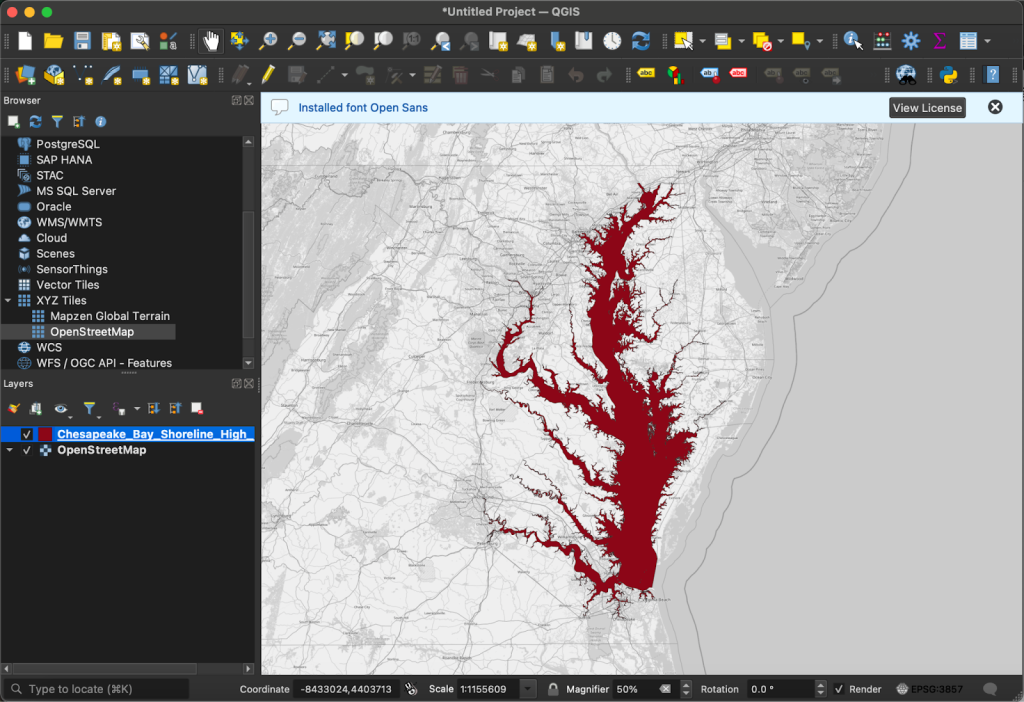
Esri’s ArcGIS Pro 3.7 hyperspectral tools bring professional-grade spectral analysis inside the mainstream GIS platform. The geodesic flow direction and culvert-aware hydrological modeling extend its reach into environmental workflows that have historically relied on dedicated scientific tools. QGIS’s AI agent integrations continued to expand, with Open Geospatial Solutions publishing tutorials combining NASA OPERA data retrieval and satellite timelapse via natural language interfaces. That workflow template is becoming easier to reproduce.
Open Source Ecosystem
GDAL 3.13.0 “Iowa City” released on Sunday, the first major version since 3.12. GDAL underpins the entire geospatial stack, commercial and open source alike, so version increments ripple through hundreds of dependent tools. Organizations running automated pipelines should begin compatibility testing. Downstream distributions will take several months to propagate.
The OGC’s elevation of openEO to Community Standard status is both a standards milestone and an open-source ecosystem win. openEO standardizes the API for processing large-scale EO data in cloud environments, reducing workflow fragmentation across platforms. Standards compliance in procurement-driven environments will accelerate adoption, which benefits users but challenges platforms whose value proposition depends on workflow lock-in.
Oslandia published a detailed analysis of the QGIS version lifecycle covering the current LTR and Regular Release cadence. It is practically useful for organizations managing QGIS deployments at scale. FOSS4G North America’s guidance on abstract submissions shows an active call for practitioner content ahead of its 2026 conference.
Watch List
In-orbit processing: The Spiral Blue × Arlula deal is the latest indication that edge processing on satellite buses is becoming a distributable product, rather than a research-only capability. Watch for distribution platform consolidation as more in-orbit processors come to market.
EW-resilient positioning: The BAE Systems GXP × Vantor partnership suggests that GPS-denied or GPS-spoofed environments are now a baseline design assumption in defense geospatial procurement. Civilian critical infrastructure operators, including energy, transport, and utilities, may face regulatory pressure to follow.
AI-driven open data governance: The Dollins and Overture arguments this week are credible early indicators. If AI training and inference workloads continue consuming open geospatial data at scale, expect a governance debate about access tiers, rate limits, or AI licensing terms for open data, potentially within 18 months.
Foundation models in EO analytics: Google’s AlphaEarth production maps show that commodity EO analysis is moving up the stack, toward foundation model output and away from per-project model development. Firms whose revenue depends on bespoke EO model development should be tracking this closely.
Australian geospatial investment: Multiple developments this week, including SAR development, ICEYE’s resilience case study, and Spatial Information Day, suggest Australia is entering an active infrastructure investment phase. International vendors with Australian presences should be positioning.
Top Posts of the Week
- The Billion-Dollar Data Trap: Why Building Your Own Map is No Longer a Viable Business Strategy, Overture Maps Foundation
A strategic argument that the AI efficiency imperative makes proprietary planetary-scale map data economically unsustainable. This is the most direct statement yet of Overture’s market thesis. - Scaling Transparency: Annual, Pan-Tropical Commodity Maps Powered by AlphaEarth Foundations, Google Earth and Earth Engine
The first production-scale demonstration of Google’s Satellite Embedding Foundation Models generating analysis-ready continental outputs. It sets a new benchmark for what foundation models can deliver in applied EO. - Open Data and AI, geoMusings (Bill Dollins)
A clear-eyed analysis of AI as a new and poorly understood class of open data consumer, raising questions that the geospatial community has not yet seriously organized around. - Geography and the Future of Sovereign AI in Canada, Strategic Geospatial
Makes the case that sovereign AI strategy is inseparable from sovereign geospatial data infrastructure. The argument is relevant well beyond Canada. - Open Cosmos Builds Atlantic Satellite Constellation To Advance European Earth Observation Capability, Geoconnexion
Final design reveal for ESCA’s eight-satellite EO constellation, the most concrete European sovereign space infrastructure announcement of the year so far.
Cercana Executive Briefing is generated from 161 feeds aggregated by geofeeds.me.