Organizations invested heavily in geospatial tools and data throughout 2025. Yet many leaders found the return on that investment lower than expected. A core issue is fragmentation rather than a lack of data or technology capability. When spatial data is scattered across teams, tools, and formats, it becomes harder to trust, harder to maintain, and harder to use for meaningful decisions.
This is why 2026 will reward organizations that focus not on bigger geospatial systems, but on cleaner, right-sized spatial data pipelines that deliver clarity rather than complexity.
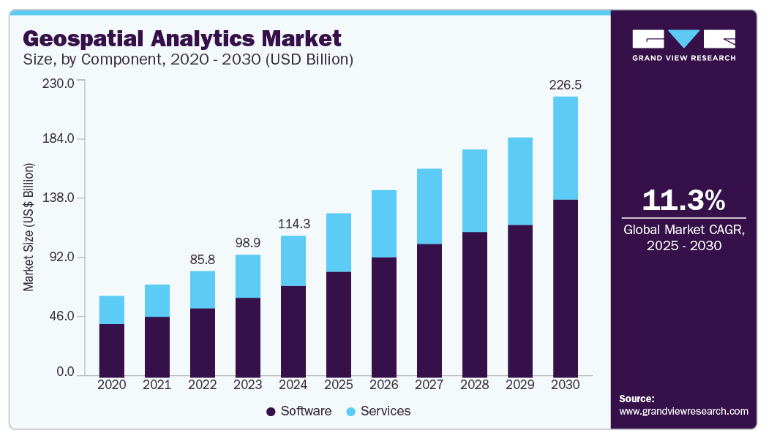
Industry forecasts reflect this shift. Analysts estimate the global geospatial analytics market at $114 billion in 2024, projecting growth to more than $226 billion by 2030 (Grand View Research, 2024). Another independent forecast places the market at $258 billion by 2032, driven by adoption across infrastructure, logistics, and smart-city applications (Fortune Business Insights, 2024). But as adoption accelerates, complexity rises: many organizations still struggle with data quality and context, which remain barriers to effective geospatial insight (Korem, 2025).
Costs of Fragmentation
Fragmentation rarely announces itself. It appears subtly in duplicate datasets, inconsistent update cycles, siloed maps, or “shadow” spatial layers created by individual teams. These inconsistencies introduce persistent operational friction:
- Analysts spend more time reconciling data than interpreting it.
- Cross-functional teams make decisions based on slightly different versions of the truth.
- Trust in spatial outputs erodes as discrepancies accumulate.
Broader technology trend research highlights the same issue: modern digital environments are growing more complex, making integration discipline essential (McKinsey & Company, 2025). Nowhere is this truer than in geospatial workflows, where inconsistent data pipelines undermine the insights organizations depend on.
Bigger Systems != Bigger Insight
A persistent misconception is that impactful geospatial work requires enterprise-scale GIS stacks, large teams, or massive datasets. But today’s ecosystem offers a spectrum of tools, from legacy proprietary solutions like ArcGIS to modern enterprise-grade open-source platforms using tools such as DuckDB or Sedona, and an expanding set of specialized tools used across planning, logistics, environmental management, and operations. Independent analysis notes that GIS platforms enable organizations to integrate spatial data, visualize patterns, and support decision-making across sectors ranging from transportation to public safety (Research.com, 2025). Leaders can match tools to decisions rather than building infrastructure for its own sake.
Industry observers note similar trends: cloud-based GIS, AI-driven spatial analytics, and real-time data streams increasingly enable organizations of all sizes to integrate geospatial insight into their decision frameworks (LightBox, 2025). The threshold for adopting spatial intelligence is lower than ever — provided data pipelines remain clean and coherent.
ROI in Small, Targeted Spatial Insights
Some of the highest-value geospatial outcomes arise not from extensive datasets but from small, curated insights aligned to operational needs:
- Identifying which assets fall inside specific risk zones.
- Visualizing coverage gaps or service inconsistencies through a single boundary overlay.
- Pinpointing route or deployment inefficiencies affecting field productivity.
Innovation trends reinforce this path. New geospatial entrants are developing AI-assisted mapping tools that allow non-technical teams to generate spatial insights without relying on specialized staff (Business Insider, 2025). This democratization of spatial intelligence reduces the need for one-off, isolated datasets, helping to prevent fragmentation before it starts.
MapIdea offers a particularly relevant perspective: geography can serve as a unifying analytical key, allowing organizations to connect datasets that share no other identifiers and reduce fragmentation across systems (MapIdea, 2025).
How To Start Simplifying in 2026
A right-sized approach doesn’t require heavy investment. It requires intentional design:
- Establish authoritative versions of key spatial datasets and retire duplicates.
- Align update cycles with operational rhythms, whether monthly or real-time.
- Integrate spatial data into existing analytics environments rather than building parallel systems.
- Start with one meaningful decision, demonstrate value, and scale deliberately.
These steps reduce friction, strengthen trust, and create a foundation for more advanced geospatial capability in the future.
The 2026 Opportunity
As the geospatial analytics market continues to grow at double-digit rates, organizations face a choice: accumulate complexity or pursue clarity.
Right-sized geospatial, built on coherent pipelines and targeted insights, offers a practical path forward. It replaces fragmentation with consolidation, trades overhead for agility, and most importantly, it positions geography as a shared context for informed, decision-making across your organization.
Cercana can help you streamline your geospatial data portfolio and operations. Contact us today to learn more.
References
Business Insider. (2025). AI-powered mapping platform secures funding for next-generation geospatial tools. https://www.businessinsider.com/felt-ai-mapping-platform-funding-geographic-information-system-2025-7
Fortune Business Insights. (2024). Geospatial analytics market report. https://www.fortunebusinessinsights.com/geospatial-analytics-market-102219
Grand View Research. (2024). Geospatial analytics market size, share & trends analysis report. https://www.grandviewresearch.com/industry-analysis/geospatial-analytics-market
Korem. (2025). Geospatial trends in 2025: The latest industry evolutions. https://www.korem.com/geospatial-trends-in-2025-the-latest-industry-evolutions
LightBox. (2025). Top 10 trends in GIS technology for 2025. https://www.lightboxre.com/insight/top-10-trends-in-gis-technology-for-2025
MapIdea. (2025). Open letter to data and analytics leaders on geography. https://www.mapidea.com/blog/open-letter-to-data-and-analytics-about-geo
McKinsey & Company. (2025). Technology trends outlook 2025. https://www.mckinsey.com/~/media/mckinsey/business%20functions/mckinsey%20digital/our%20insights/the%20top%20trends%20in%20tech%202025/mckinsey-technology-trends-outlook-2025.pdf
Research.com. (2025). Best geographic information systems (GIS) in 2026. https://research.com/software/guides/best-geographic-information-systems
Header Image Credit: National Oceanic and Atmospheric, Public Domain