A Novice Takes a Stab at GIS

For the last handful of months, I’ve been working with my father’s company, Cercana Systems, to assist with content marketing and business development. In college, I finished most of a public relations degree at The University of Alabama before the first of my two daughters graced us with her presence and we decided to move back home to Maryland in order for her to actually have her extended family in her life. Since that time, I’ve found myself wanting more and more to find a way to help build things that provide a more tangible contribution to the world around me. Then, two weeks ago, I had the opportunity to attend FedGeoDay 2025 and decided it was time to start teaching myself some novice-level GIS skills. 

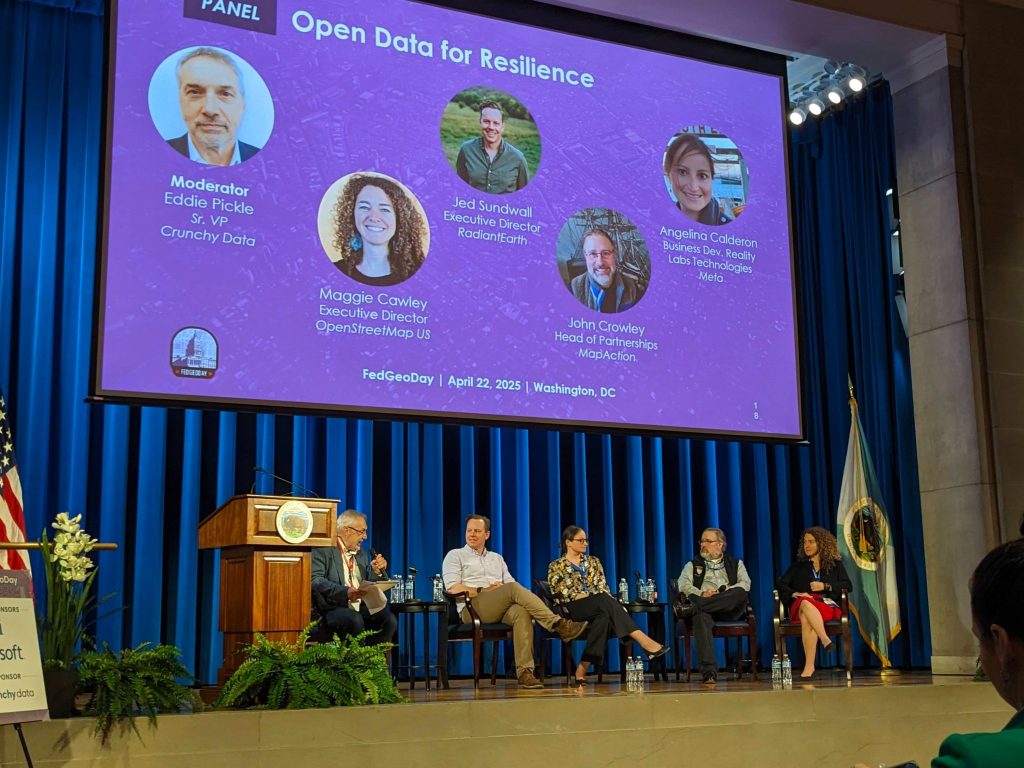
This year’s FedGeoDay theme of “open resilience” brought out a host of presenters that were using open geospatial ecosystems to do highly critical work in disaster prediction, preparation, and response. Everyone there was doing work that was well worth doing.

That brings us to the purpose of this blog post. It is the first in a series of undetermined length about me teaching myself how to use QGIS as a first foray into learning GIS skills. I am a complete novice with no coding or technical background of any kind. My hope is that documenting the process of attempting to make my first data-visualization in a commonly used tool may help others that want to delve into the field get past any apprehension they have about getting off the starting block. 

Step 1 – Pick a topic and find data

Initially, I had wanted to create a handful of heat maps that showed the change in the number of youth lacrosse programs in the mid-atlantic over the last 15 years. I turned to Chat GPT to source the data, but the engine was unable to find historical records for me to use.

“I want to build a heat map showing change over time in the concentration of youth lacrosse programs in the states of Maryland, Virginia, Delaware, New Jersey, Pennsylvania, North Carolina, West Virginia, and the District of Columbia. Could you scour the internet for data that I can use for this and put the data in a spreadsheet? The spread sheet should have three columns. The first column will indicate the year, the second will indicate the county, and the third should indicate the number of youth teams in that county. Let’s look at Spring teams only, not Fall, Winter, or Summer. Data should go back 15 years (2010-2025). Let’s consider “youth lacrosse” to be teams for children as old as 8th grade or 14 years of age. Some teams will use the “under X” age categorization, some will use the projected year of high school graduation, and some will just indicate a standard age range or grade level for the children it caters to, so be sure to look out for all of those. Can you do this?”

Compiling a comprehensive dataset detailing the number of youth lacrosse teams by county from 2010 to 2025 across Maryland, Virginia, Delaware, New Jersey, Pennsylvania, North Carolina, West Virginia, and the District of Columbia presents significant challenges. The primary hurdle is the lack of publicly available, granular historical data spanning this 15-year period. While some organizations provide current information, historical records at the county level are scarce.

### Available Data and Resources

* **Maryland Youth Lacrosse Association (MYLA)**: Oversees youth lacrosse in Maryland, offering current season details and age groupings. However, historical data by county is not readily accessible on their website. ([mylalax.com][1])

* **Western Maryland Youth Lacrosse Conference (WMYLC)**: Covers counties in Western Maryland and parts of neighboring states, with a focus on promoting youth lacrosse. Specific team counts by county and year are not provided online. 

* **Anne Arundel County Recreation and Parks**: Provides detailed information on current boys’ lacrosse leagues, including age divisions and game schedules. Historical data is not available on their platform. ([Anne Arundel County Government][2])

* **Inside Lacrosse Articles**: Discuss trends in lacrosse participation, noting shifts in player demographics and regional growth. These articles offer insights but lack specific county-level data over the desired time frame. ([Inside Lacrosse][3])

### Challenges in Data Compilation

* **Data Availability**: Most organizations do not maintain or publicly share historical team counts by county.

In the real world, sourcing and compiling accurate data can often be the bulk of the work done on a GIS project. However the point of this pursuit is to learn how to use QGIS, not spend countless hours calling up the Parks and Rec department of every county in the Mid-Atlantic, so I decided to pivot to something else.

So now, I’m looking for historical data over the last 15 years on the blue crab population in various sections of the Chesapeake Bay estuary. My new goal will be to create one map that shows the places where the population has increased the most, increased the least, and even decreased since 2010. 

This information was readily available from Maryland’s Department of Natural Resources, with one caveat. 

There was plenty of data on blue crab population available, but I wasn’t finding any that was split up into certain regions of the bay. Nonetheless, creating the map and shading the entire Bay based on percent change in population density from the median of the data year-to-year is a good beginner project to learn anything about QGIS at all, so we’re rolling with it. 

Step 2 – Installing QGIS

While it may seem like a silly step to document, this is supposed to be a properly novice guide to making a map in QGIS, and it’s a touch difficult to do that without installing the program. The machine I’m using is a 2020 M1 Macbook Air running Sonoma 14.6.1. I downloaded the installer for the “long term” version of QGIS from qgis.org, went through the install process, and attempted to open it. 

Naturally, my Macbook was less than thrilled that I was attempting to run a program that I hadn’t downloaded from the app store. It was completely blocking me from running the software when I opened it from the main application navigation screen. This issue was resolved by going to the “Applications” folder in Finder and using the control+left click method. A warning popped up about not being able to verify that the application contained no malware, I ran it anyway, and I have not had any issues opening the application since then. 

The next step will be to actually crack QGIS open and begin creating a map of the Chesapeake Bay. 

Reflections on the Process of Planning FedGeoDay 2025

What is FedGeoDay?

FedGeoDay is a single-track conference dedicated to federal use-cases of open geospatial ecosystems. The open ecosystems have a wide variety of uses and forms, but largely include anything designed around open data, open source software, and open standards. The main event is a one day commitment and is followed by a day of optional hands-on workshops. 

FedGeoDay has existed for roughly a decade , serving as a day of learning, networking, and collaboration in the Washington, D.C. area. Recently, Cercana Systems president Bill Dollins was invited to join the planning committee, and served as one of the co-chairs for FedGeoDay 2024 and 2025. His hope is that attendees are able to come away with practical examples of how to effectively use open geospatial ecosystems in their jobs. 

Photo courtesy of OpenStreetMap US on LinkedIn.

“Sometimes the discussion around those concepts can be highly technical and even a little esoteric, and that’s not necessarily helpful for someone who’s just got a day job that revolves around solving a problem. Events like this are very helpful in showing practical ways that open software and open data can be used.”

Dollins joined the committee for a multitude of reasons. In this post, we will explore some of his reasons for joining, as well as what he thinks he brings to the table in planning the event and things he has learned from the process. 

Why did you join the committee?

When asked for some of the reasons why he joined the planning committee for FedGeoDay, Dollins indicated that his primary purpose was to give back to a community that has been very helpful and valuable to him throughout his career in a very hands-on way. 

“In my business, I derive a lot of value from open-source software. I use it a lot in the solutions I deliver in my consulting, and when you’re using open-source software you should find a way that works for you to give back to the community that developed it. That can come in a number of ways. That can be contributing code back to the projects that you use to make them better. You can develop documentation for it, you can provide funding, or you can provide education, advocacy, and outreach. Those last three components are a big part of what FedGeoDay does.”

He also says that while being a co-chair of such an impactful event helps him maintain visibility in the community, getting the opportunity to keep his team working skills fresh was important to him, too. 

“For me, also, I’m self-employed. Essentially, I am my team,” said Dollins. “It can be really easy to sit at your desk and deliver things and sort of lose those skills.”

What do you think you brought to the committee?

Dollins has had a long career in the geospatial field and has spent the majority of his time in leadership positions, so he was confident in his ability to contribute in this new form of leadership role. Event planning is a beast of its own, but early on in the more junior roles of his career, the senior leadership around him went out of their way to teach him about project cost management, staffing, and planning agendas. He then was able to take those skills into a partner role at a small contracting firm where he wore every hat he could fit on his head for the next 15 years, including still doing a lot of technical and development work. Following his time there, he had the opportunity to join the C-suite of a private sector SaaS company and was there for six years, really rounding out his leadership experience. 

He felt one thing he was lacking in was experience in community engagement, and event planning is a great way to develop those skills. 

“Luckily, there’s a core group of people who have been planning and organizing these events for several years. They’re generally always happy to get additional help and they’re really encouraging and really patient in showing you the rules of the road, so that’s been beneficial, but my core skills around leadership were what applied most directly. It also didn’t hurt that I’ve worked with geospatial technology for over 30 years and open-source geospatial technology for almost 20, so I understood the community these events serve and the technology they are centered around,” said Dollins.

Photo courtesy of Ran Goldblatt on LinkedIn.

What were some of the hard decisions that had to be made?

Photo Courtesy of Cercana Systems on LinkedIn.

Attendees of FedGeoDay in previous years will likely remember that, in the past, the event has always been free for feds to attend. The planning committee, upon examining the revenue sheets from last year’s event, noted that the single largest unaccounted for cost was the free luncheon. A post-event survey was sent out, and federal attendees largely indicated that they would not take issue with contributing $20 to cover the cost of lunch. However, the landscape of the community changed in a manner most people did not see coming.

“We made the decision last year, and keep in mind the tickets went on sale before the change of administration, so at the time we made the decision last year it looked like a pretty low-risk thing to do,” said Dollins.

Dollins continued to say that while the landscape changes any time the administration changes, even without changing parties in power, this one has been a particularly jarring change. 

“There’s probably a case to be made that we could have bumped up the cost of some of the sponsorships and possibly the industry tickets a little bit and made an attempt to close the gap that way. We’ll have to see what the numbers look like at the end. The most obvious variable cost was the cost of lunches against the free tickets, so it made sense to do last year and we’ll just have to look and see how the numbers play out this year.”**

What have you taken away from this experience?

Dollins says one of the biggest takeaways from the process of helping to plan FedGeoDay has been learning to apply leadership in a different context. Throughout most of his career, he has served as a leader in more traditional team structures with a clearly defined hierarchy and specified roles. When working with a team of volunteers that have their own day jobs to be primarily concerned with, it requires a different approach. 

“Everyone’s got a point of view, everyone’s a professional and generally a peer of yours, and so there’s a lot more dialogue. The other aspect is that it also means everyone else has a day job, so sometimes there’s an important meeting and the one person that you needed to be there couldn’t do it because of that. You have to be able to be a lot more asynchronous in the way you do these things. That’s a good thing to give you a different approach to leadership and team work,” said Dollins on the growth opportunity. 

Dollins has even picked up some new work from his efforts on the planning committee by virtue of getting to work and network with people that weren’t necessarily in his circle beforehand. Though he’s worked in the geospatial field for 30 years and focused heavily on open-source work for 20, he says he felt hidden away from the community in a sense during his time in the private sector. 

Photo courtesy of Lane Goodman on LinkedIn.

“This has helped me get back circulating in the community and to be perceived in a different way. In my previous iterations, I was seen mainly from a technical perspective, and so this has kind of helped me let the community see me in a different capacity, which I think has been beneficial.”

FedGeoDay 2025 has concluded and was a huge success for all involved. Cercana Systems looks forward to continuing to sponsor the event going forward, and Dollins looks forward to continuing to help this impactful event bring the community together in the future. 

Photo courtesy of Cercana Systems on LinkedIn.

**This interview was conducted before FedGeoDay 2025 took place. The event exceeded the attendance levels of FedGeoDay 2024.